Car Price Inflation Is Real – These Brands Are the Worst [2025 Update]
![Featured image for Car Price Inflation Is Real – These Brands Are the Worst [2025 Update]](https://d2bq9obxtvkjtt.cloudfront.net/astro-blogs-images/car-price-inflation/2024-08-22_Big-Data-Update_-Car-Price-Inflation_Blog-Header-Image_1920x1080_v1.webp)
Key Takeaways
- Car price increases have far surpassed the rate of inflation over the past five years.
- Volkswagen Group and Hyundai Group had the largest price increases from 2020 to 2025.
- Among luxury brands, Cadillac and Infiniti had the largest price hikes.
- In 2025, the average new car sells for $48,749, a 30% increase from five years prior.
This decade has brought a whirlwind of challenges for the automotive industry. From pandemic shortages and EV investments to today’s inflation and tariff pressures, lack of stability would be an understatement. So, how have car prices fared over the last five years? Across the new car market, average transaction prices have increased by 30% from Q2 2020 to Q2 2025. The average selling price for a new car now stands at $48,749.
But some automakers seem to have thrown caution to the wind, pushing their prices far higher. Here’s a look at car price inflation over the last five years.
Volkswagen Group Prices Increased the Most
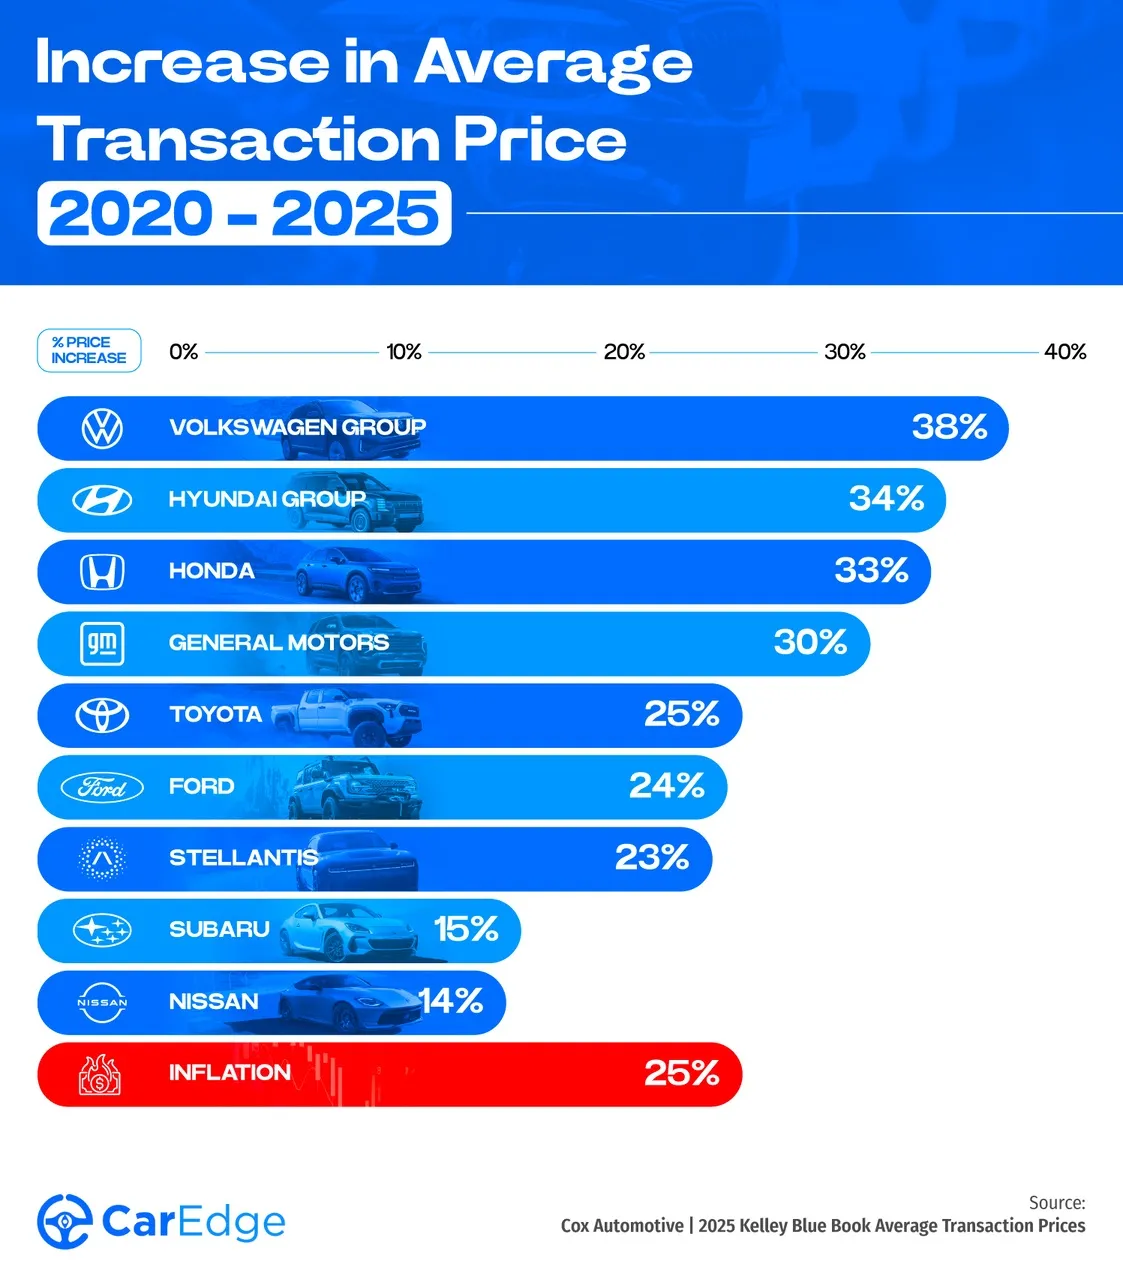
Leading the pack in price hikes is Volkswagen Group, which includes VW, Audi, Porsche, Bentley, and Lamborghini in the United States. The average transaction price for Volkswagen Group has increased by 38% from Q2 2020 to Q2 2025, which is quite a bit higher than the overall economy’s inflation (25%) over the same period.
Hyundai Group (which includes Kia) and Honda are close behind. Hyundai Group prices are up 34% in the first half of this decade. EVs like the new IONIQ 9 are a big reason for the price hike. Honda prices increased by 33% from 2020 to 2025 as MSRPs increased and buyers showed increasing preference for larger SUVs. Honda’s best-seller, the CR-V crossover, saw base MSRPs jump from $26,345 in 2019 to $31,495 in 2025.
General Motors is next in line, with prices up 30% since 2020. Chevrolet and Cadillac prices have risen as EVs have populated the lineup, and trucks like the Silverado 1500 get ever more expensive. In 2020, the Chevy Silverado 1500 RST started at $38,695. For 2025, that same spec of the Silverado starts at $52,345.
Subaru and Nissan Prices Increased the Least
However, there’s a bright spot in the data. Ford, Stellantis, Nissan, and Subaru price increases were below the overall rate of inflation over the past five years. Data was unavailable for Mazda.
Subaru seems to have taken a different strategy with a five-year transaction price increase of only 15%, well below the pace of overall inflation. Subaru has managed to maintain an upward trajectory in terms of market share. This gain, paired with standard offerings like all-wheel drive, could be a testament to the importance of price competitiveness in the industry.
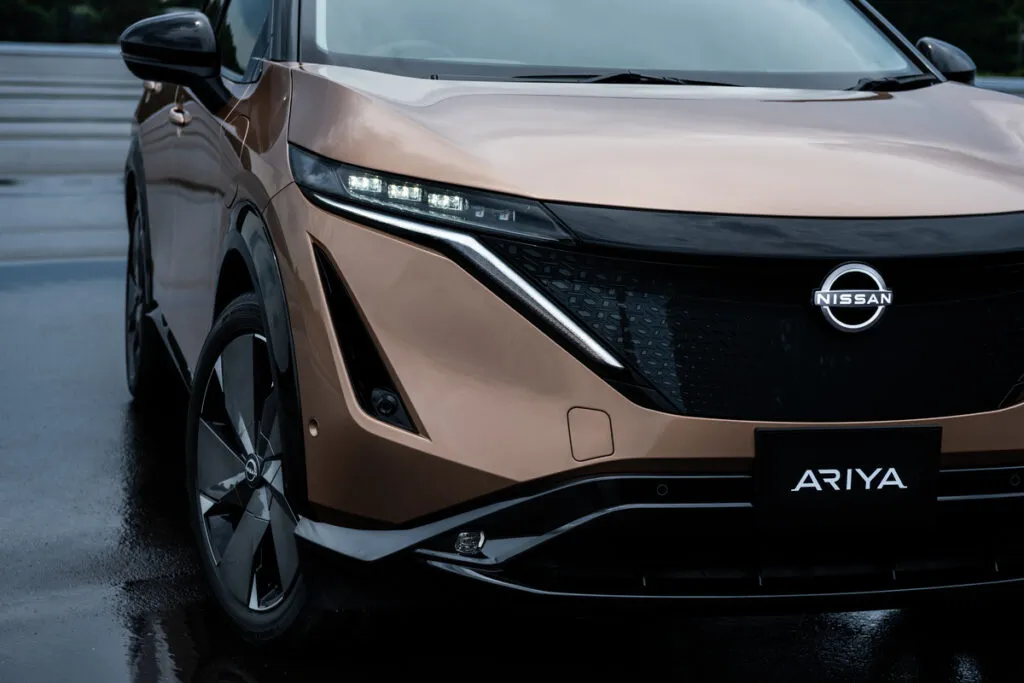
Nissan, on the other hand, has likely seen less price increases for a different reason. Nissan has been losing U.S. market share for years as Toyota, Honda, Hyundai, and Kia win over budget shoppers. When demand falls, dealer markups and MSRPs soften. Since 2019, Nissan transaction prices have risen 14%. And now, two of Nissan’s most popular and affordable models, the Altima and Versa, are being discontinued next year.
Luxury Car Prices Have Risen 25%
To the detriment of vehicle affordability, luxury cars are more popular than ever. More drivers are paying over $80,000 for a new car or truck than ever before. Oddly enough, luxury car prices haven’t climbed quite as much over the past half-decade. While mainstream car brands saw prices climb 30%, luxury brands increased by 25% from 2020 to 2025.
Here’s a look price inflation for some of the best-selling luxury brands in America compare. Note that Tesla is not included due to lack of publicly-available data from 2020.
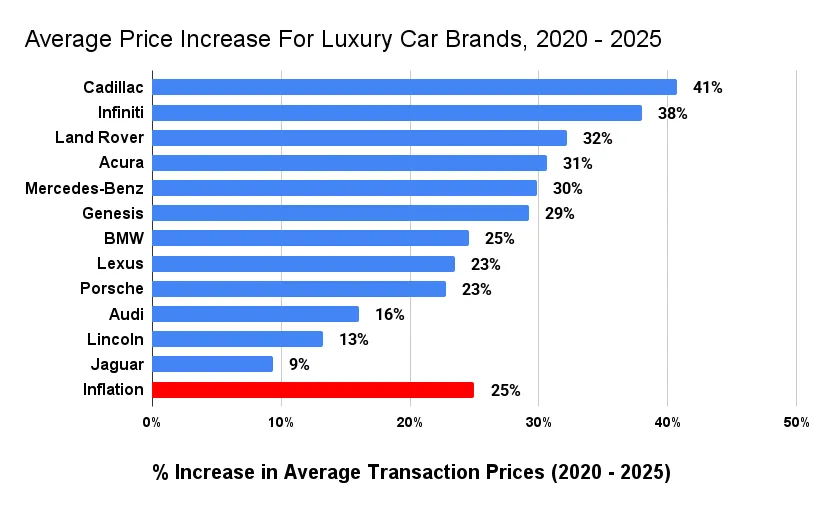
Prices for new Cadillac, Infiniti, Land Rover, Acura, and Mercedes-Benz cars have all had average selling prices rise more drastically than their luxury competitors. All of these luxury cars now sell for at least 30% more than the did just five years prior.
On the other hamd, the luxury car brands with the lowest price increases are Jaguar, Lincoln, and Audi. Audi’s sales have slipped as the brand’s EVs fail to keep up with the competition in the crowded luxury crossover segment.
How to Shop Smart in 2025
It’s true that new cars are a lot more expensive these days, but that doesn’t mean you have to surrender and sign whatever the dealer offers. There are still practical ways to save, even in 2025. Here are a few smart car buying tips from CarEdge Co-Founders, father-and-son duo Zach and Ray Shefska:
Use Market Data, Not MSRP
Rely on real-time transaction and listing data (like CarEdge Pro) to understand what others are actually paying in your area.
Target the Slow Sellers
Focus on vehicles with high inventory and long time-on-lot. Dealers are more willing to negotiate on slow movers. We’ve got tools to help you find negotiable inventory.
Look for Dealer-Backed Incentives
Even when automaker incentives are weak, individual dealers may offer their own discounts, especially near end-of-month or quarterly sales targets.
Negotiate More Than Just Price
Push for better financing terms, trade-in value, or extras like extended warranties or free maintenance. Here’s our guide to what’s negotiable at the dealership.
Time Your Purchase Strategically
Shop at the end of the month, end of the quarter, or during seasonal clearance events (like model year transitions). There’s even a better time of the day to buy! Be sure to check out our free tips for timing your purchase right.
Use AI Tools to Level the Playing Field
AI can be terrifying, but it can also be extremely helpful. CarEdge’s AI Negotiator can take the pressure off and ensure you don’t overpay. How does CarEdge AI work? Tell us what car you want, and our AI Negotiator will contact dealers and negotiate pricing for you! It’s really, really cool.
Ready for some expert car buying help to ensure you pay a fair price? That’s why we created CarEdge, the ultimate car buyer’s advocate. Learn more about how our team of consumer advocates is ready to assist you with your deal at CarEdge.com.
Free Car Buying Help Is Here
In 2025, the car market is changing. For the first time in years, great deals can be won with negotiation know-how. Utilizing tools like CarEdge’s FREE Car Buyer’s Guide can give you a better idea of current inventory levels and help you determine where the best deals might be.

Ready to outsmart the dealerships? Download your 100% free car buying cheat sheets today. From negotiating a deal to leasing a car the smart way, it’s all available for instant download.
Sponsored by Insurify
Are you overpaying for car insurance?
Compare rates from top carriers in under 5 minutes. CarEdge users save an average of $996/year on auto insurance.
*Disclosure: CarEdge may earn a commission when you compare insurance quotes through our partner, Insurify. This does not influence our editorial content.*