The Average New Car Is $49,000 — America’s Top-Sellers Cost $7,000 Less
Key Takeaways
- The 20 best-selling vehicles in America averaged $42,149 in March, about $7,300 less than KBB's industry-wide figure.
- Automakers nudged incentives higher in February, but the average discount is barely different from a year ago. EVs are the exception, where deals have surged.
- Leverage local car market price data to get the best deal with the less hassle.
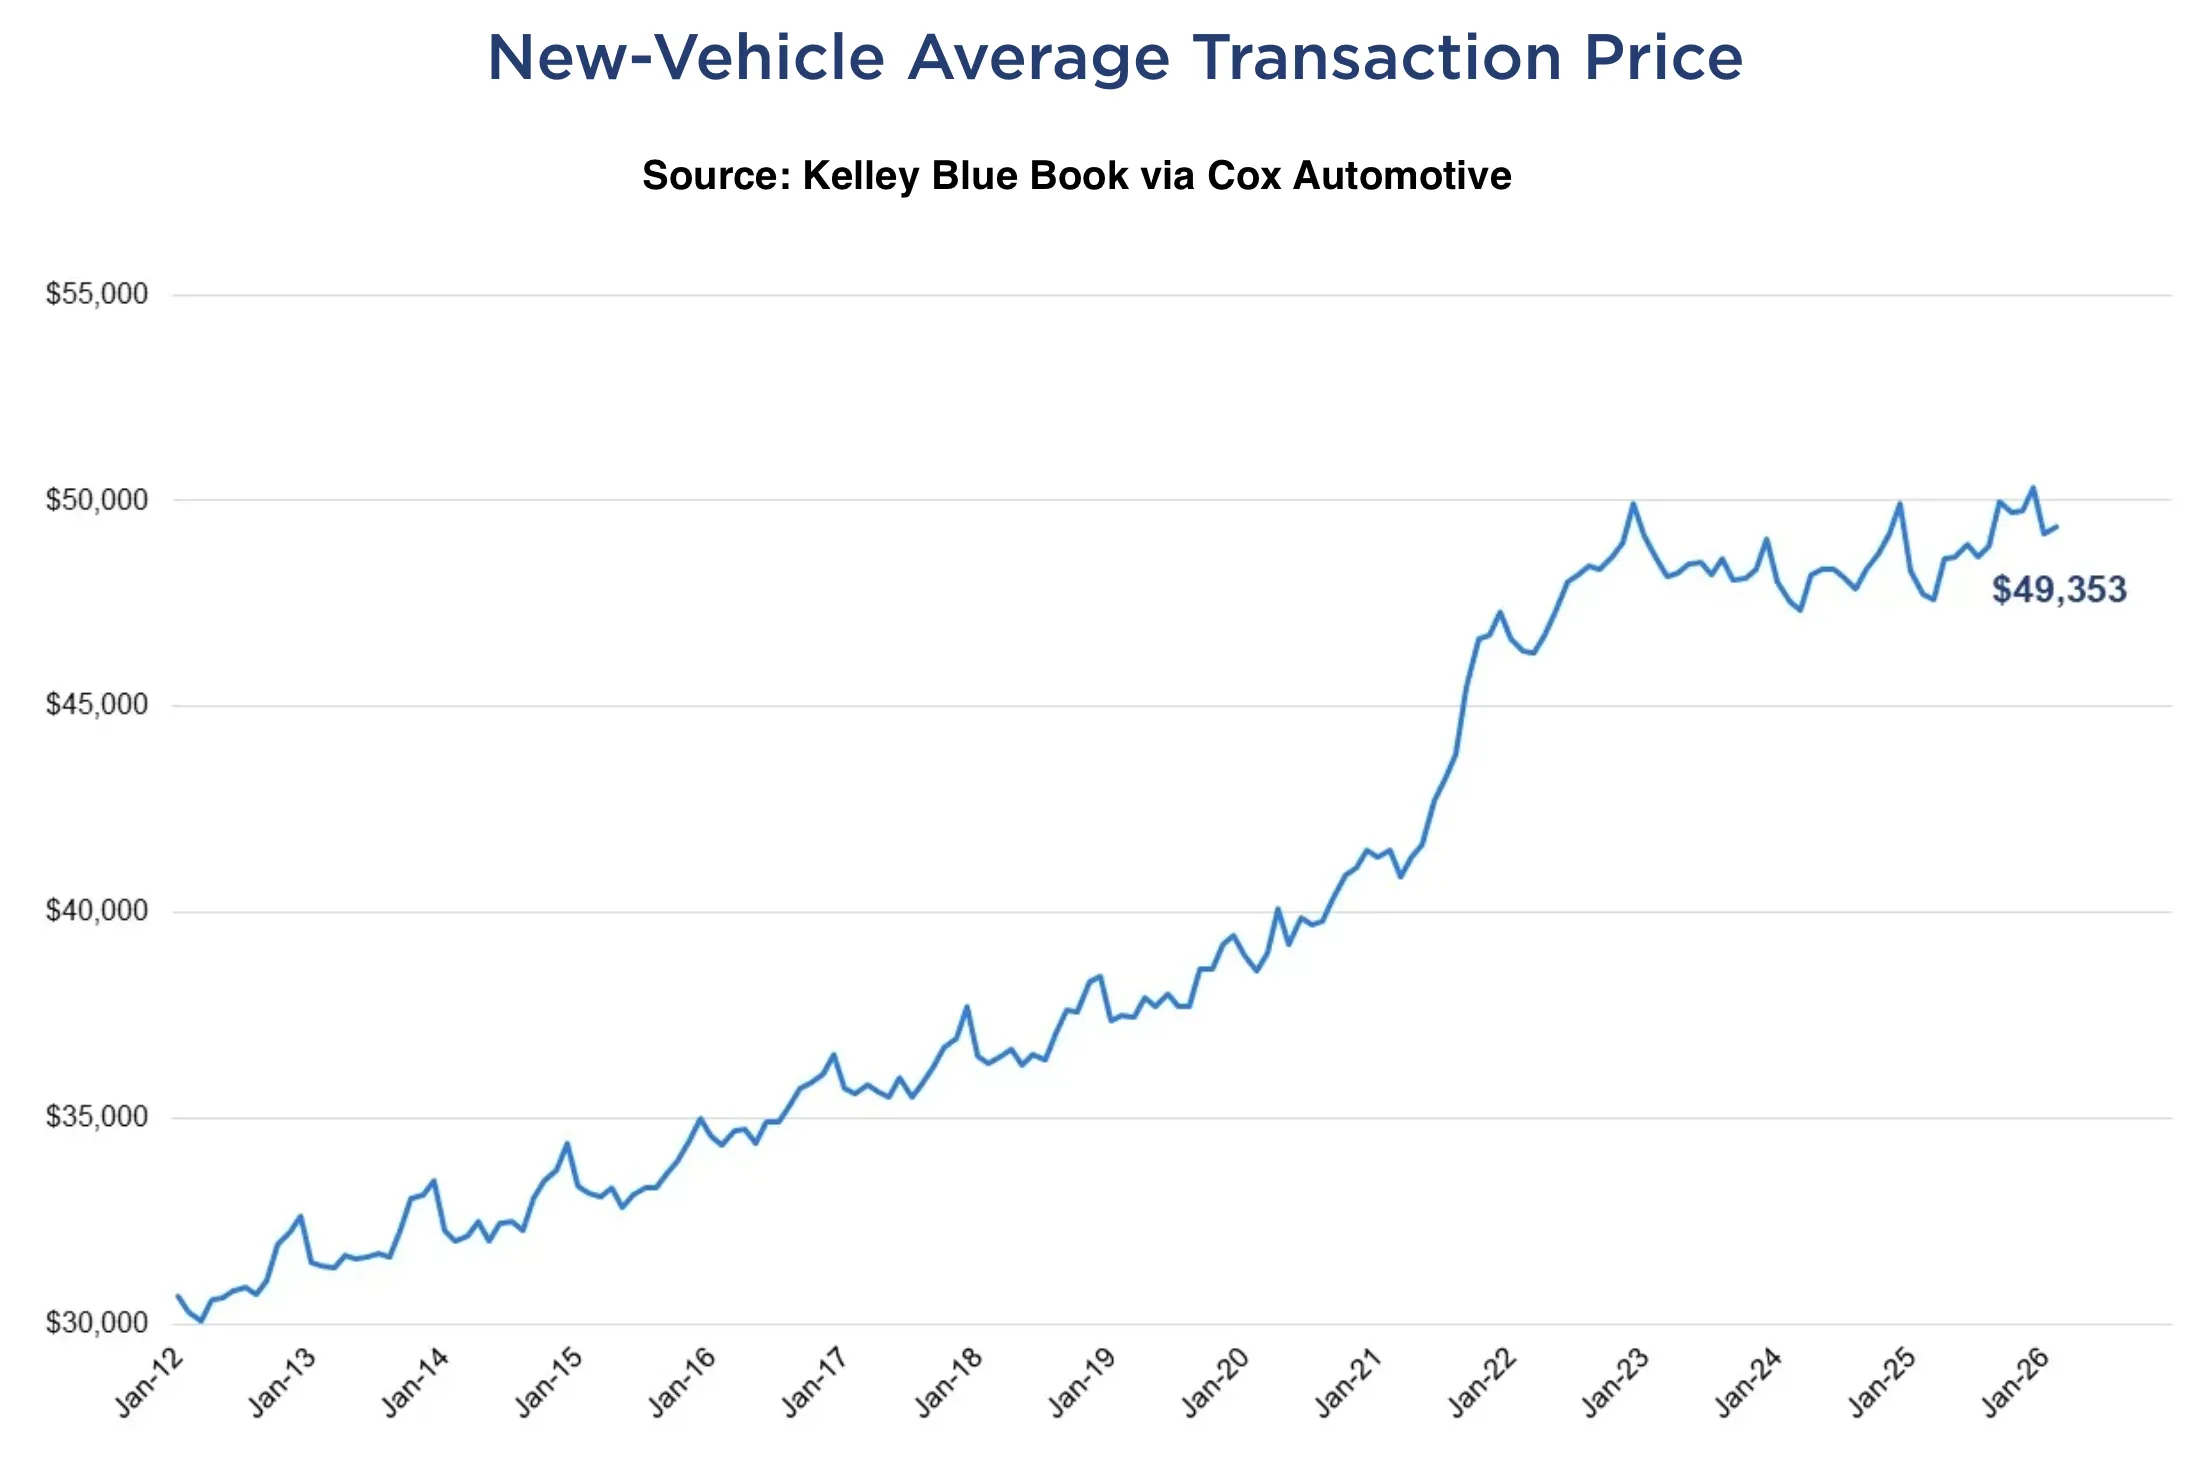
If you’ve seen the headlines this week, you might think buying a new car just got a lot more expensive. According to the latest data from Kelley Blue Book, the average new vehicle transaction price hit $49,353 in February, a 3.4% jump since last year, and one of the bigger annual gains in recent memory.
However, the latest CarEdge analysis of mainstream car prices shows that market averages can be a little misleading. Let’s take a look at the latest new car price updates, and what they mean for car buyers this spring.
KBB’s Average Remains Just Under $50,000
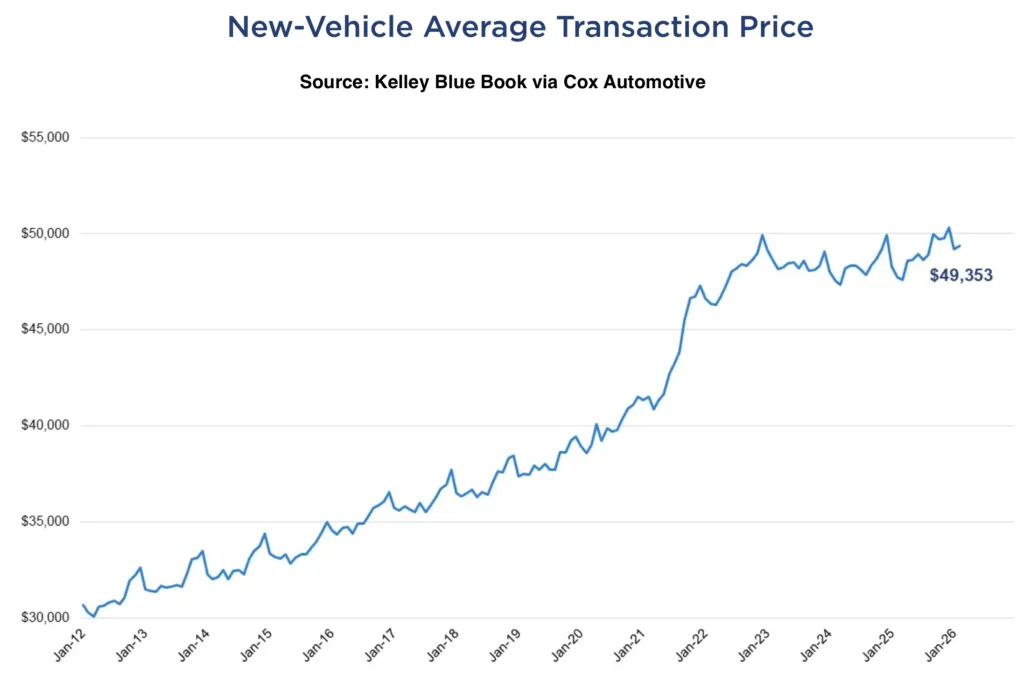
Each month, Kelley Blue Book and Cox Automotive publish average transaction price data across the entire new vehicle market. In February, that industry-wide average came in at $49,353, up 3.4% from a year ago. For context, the average annual price increase over the past three years has been closer to 0.9%, so February’s gain stands out.
The average sticker price crossed $50,000 for the eleventh month in a row, landing at $51,440.
On the incentives front, automakers nudged discounts slightly higher. The average incentive package worked out to 6.9% of transaction price in February, up from 6.5% in January. But compared to a year ago, when incentives averaged 7.0%, buyers aren’t actually getting meaningfully more relief. The deals are about the same.
A few segments worth noting:
- Full-size pickups averaged $66,157, the most expensive major segment by a wide margin
- Midsize SUVs came in at $50,148
- Compact SUVs, the second best-selling segment in the country, averaged $36,807
On the EV side, prices continued to fall. The average EV transaction price dropped 1.4% year over year to $55,300. But automakers are leaning hard on incentives to move them, with the average EV discount now sitting at 14.2% of transaction price. That’s more than double the industry average, which tells you something about where demand actually stands.
Why ‘Average’ Isn’t the Whole Story
Here’s the thing about industry-wide averages: they include everything. Low-volume luxury sedans, six-figure SUVs, exotic sports cars — they all get folded into the same number. When the average gets pulled up by vehicles that represent a small slice of total sales, it can paint a skewed picture of what most car buyers are actually facing.
This kind of headline doesn’t reflect the reality for most shoppers. The cars Americans are actually buying — in massive numbers, month after month — tend to transact well below $49,000.
So what are people actually paying? That’s where our own new car price tracker, the CarEdge Popular 20 comes in.
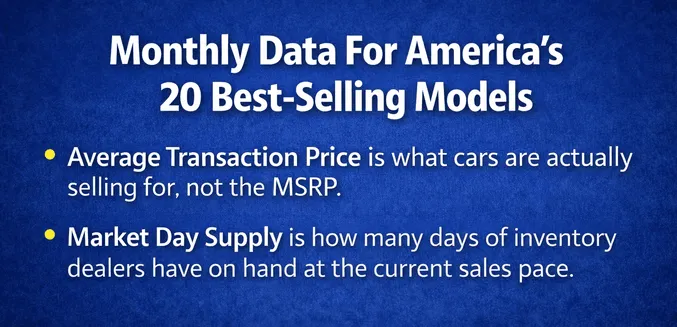
How the CarEdge Popular 20 True Average Differs
Every month, CarEdge tracks real transaction prices on the 20 best-selling vehicles in America.
The result is the CarEdge Popular 20, a monthly index that tells you what the market actually looks like for the vehicles most people are shopping for.
The CarEdge 20 isn’t meant to replace the years of great data from the likes of KBB, Cox Automotive, and Edmunds, but it serves as a new datapoint that may provide a better read on the market most consumers are in.
In February, the average transaction price of the 20 top-selling models in America was $42,016, roughly $7,300 below KBB’s industry-wide figure. In March, it nudged up slightly to $42,149, a 0.32% increase. That’s a stable, modest move, not the dramatic price surge the industry-wide average might suggest.
And several of the most popular cars in the country are transacting well under $30,000:
- Toyota Corolla: $25,828
- Chevrolet Trax: $25,676
- Honda Civic: $29,282
Eight additional models are well under $40,000. These are among the best-selling cars in America, and buyers are getting into them for prices that look a lot different than the $49K headline from KBB.
What’s Moving in March
Within the CarEdge Popular 20, there are a few trends worth watching this month.
The Subaru Outback has seen the biggest price increase since January, up 2.06% to $41,717. The new 2026 Outback didn’t just receive the full SUV treatment for the first time, it also saw a $5,000 increase in the base MSRP.
The Ford Explorer is moving in the opposite direction, with average selling prices down 1.0% to $49,455 in one month.
Trucks are telling a split story. The Ram 1500 is trending up, rising to $60,867 since January. The Ford F-150 is also creeping higher at $61,469. Meanwhile, the Chevrolet Silverado 1500 and GMC Sierra 1500 are both pulling back slightly.
It’s also worth noting that even our Popular 20 truck prices — which average around $59,000 across the four full-size models — are meaningfully below KBB’s full-size pickup segment average of $66,157. That gap likely reflects heavy-duty trims and higher configurations inflating the segment average in KBB’s average price data. The trucks most people are actually buying are cheaper than the headlines imply.
The Bottom Line for Car Shoppers
The $49,000 average transaction price from KBB shows just how much new car prices have risen since 2021. It’s especially useful for comparing long-term trends. But the vehicles Americans are actually buying most are transacting around $42,000 on average, and if you’re shopping for a compact SUV, sedan, or subcompact, you’re likely looking at something closer to $30,000 to $38,000.
Knowing what others are actually paying is the most powerful tool you have when you sit down at a dealership. That’s what CarEdge is built to give you.
Want to see what people are paying for the car you’re shopping? Check local car market data on CarEdge before you buy.
Sponsored by Insurify
Are you overpaying for car insurance?
Compare rates from top carriers in under 5 minutes. CarEdge users save an average of $996/year on auto insurance.
*Disclosure: CarEdge may earn a commission when you compare insurance quotes through our partner, Insurify. This does not influence our editorial content.*