CarEdge saved me over 4,500 dollars on a brand new Honda Pilot. I can't say thank you enough.
INFINITI Depreciation
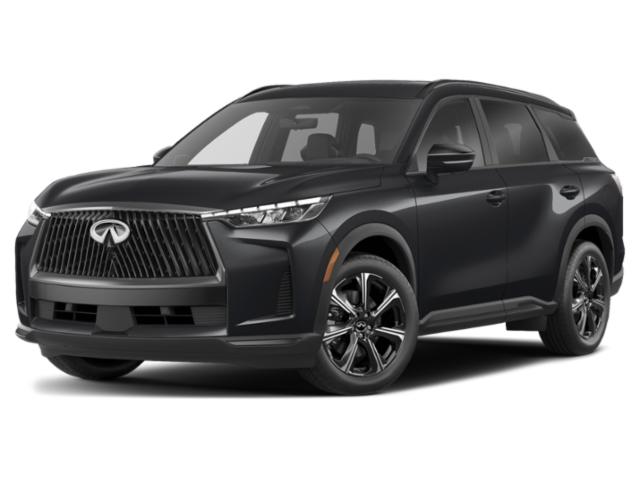
INFINITI resale performance depends on the time period you are meauring. INFINITIs lose a lot of value early on, and rank near the bottom, but improve somewhat in time, to be in the middle of the pack. Unlike some other manufacturers with vehicle models spread out across the rankings, INFINITI values have shown to be more stable and predictable. You may not be overwhelmed with how they hold their value, but at least you know where their values are headed, so you shouldn't be surprised when they get there.
2024 is our top pick for the best model year value for INFINITI vehicles. With the 2024, you would only pay, on average, 60% of the price as new, with 92% of the vehicle's useful life remaining. The 2023 and 2021 model years are also attractive years for the INFINITI models, and provide a relatively good value. Our rankings consider multiple factors, including original new prices, current prices, maintenance costs and remaining years of overall predictabe expenses. Our top ranked model year represents the most car for the money with a INFINITI model.
INFINITI Depreciation
| Year | Depreciation | Residual Value | Percent Left | Value Rating |
|---|---|---|---|---|
| 2025 | 0.0% | 100.0% | 100.0% | |
| 2024 | 40.1% | 59.9% | 91.7% | Best |
| 2023 | 41.5% | 58.5% | 83.3% | Better |
| 2022 | 44.9% | 55.1% | 75.0% | Good |
| 2021 | 55.0% | 45.0% | 66.7% | Better |
| 2020 | 62.6% | 37.4% | 58.3% | Good |
| 2019 | 64.4% | 35.6% | 50.0% | |
| 2018 | 70.0% | 30.0% | 41.7% | |
| 2017 | 73.1% | 26.9% | 33.3% | |
| 2016 | 76.2% | 23.8% | 25.0% | |
| 2015 | 78.0% | 22.0% | 16.7% | |
| 2014 | 79.6% | 20.4% | 8.3% | |
| 2013 | 81.2% | 18.8% | 0.0% |
| Year | Depreciation | Residual Value | Value Rating |
|---|---|---|---|
| 2025 | 0.0% | 100.0% | |
| 2024 | 40.1% | 59.9% | Best |
| 2023 | 41.5% | 58.5% | Better |
| 2022 | 44.9% | 55.1% | Good |
| 2021 | 55.0% | 45.0% | Better |
| 2020 | 62.6% | 37.4% | Good |
| 2019 | 64.4% | 35.6% | |
| 2018 | 70.0% | 30.0% | |
| 2017 | 73.1% | 26.9% | |
| 2016 | 76.2% | 23.8% | |
| 2015 | 78.0% | 22.0% | |
| 2014 | 79.6% | 20.4% | |
| 2013 | 81.2% | 18.8% |
Help me understand
INFINITI Depreciation by Model
Related Articles
Do Electric And Hybrid Cars Hold Their Value?

The 10 Cars, Trucks, and SUVs with the Best Resale Value in 2024

5 Trucks with the Worst Depreciation


