CarEdge saved me over 4,500 dollars on a brand new Honda Pilot. I can't say thank you enough.
Kia Depreciation
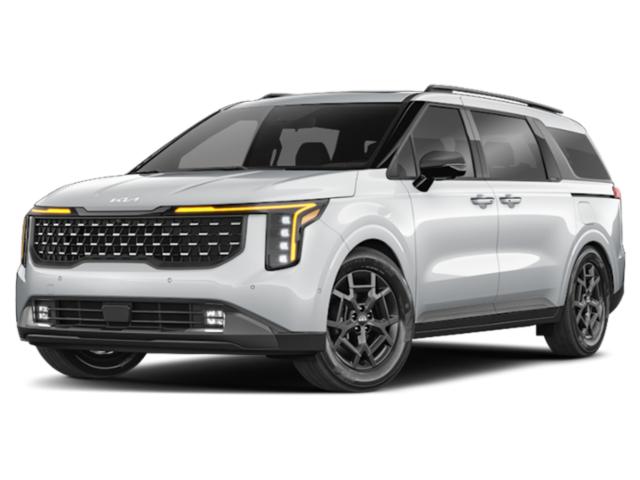
Kia, wouldn't want to be ya'-at least when it comes to resale value. Kia falls in the bottom half when looking across popular vehicle manufacturers. The exception for Kia, is their Soul model, which ranked in the top 25 of all models for value retention. What pulls Kia down, however, is their trifecta of the Sorento, Sedona and Cadenza, which all fall at the bottom of the list for overall depreciation by year 5.
2024 is our top pick for the best model year value for Kia vehicles. With the 2024, you would only pay, on average, 74% of the price as new, with 92% of the vehicle's useful life remaining. The 2023 and 2022 model years are also attractive years for the Kia models, and provide a relatively good value. Our rankings consider multiple factors, including original new prices, current prices, maintenance costs and remaining years of overall predictabe expenses. Our top ranked model year represents the most car for the money with a Kia model.
Kia Depreciation
| Year | Depreciation | Residual Value | Percent Left | Value Rating |
|---|---|---|---|---|
| 2025 | 0.0% | 100.0% | 100.0% | |
| 2024 | 25.7% | 74.3% | 91.7% | Best |
| 2023 | 29.9% | 70.1% | 83.3% | Better |
| 2022 | 36.9% | 63.1% | 75.0% | Better |
| 2021 | 42.5% | 57.5% | 66.7% | Good |
| 2020 | 48.6% | 51.4% | 58.3% | Good |
| 2019 | 52.1% | 47.9% | 50.0% | |
| 2018 | 58.3% | 41.7% | 41.7% | |
| 2017 | 60.8% | 39.2% | 33.3% | |
| 2016 | 64.5% | 35.5% | 25.0% | |
| 2015 | 67.2% | 32.8% | 16.7% | |
| 2014 | 69.6% | 30.4% | 8.3% | |
| 2013 | 71.9% | 28.1% | 0.0% |
| Year | Depreciation | Residual Value | Value Rating |
|---|---|---|---|
| 2025 | 0.0% | 100.0% | |
| 2024 | 25.7% | 74.3% | Best |
| 2023 | 29.9% | 70.1% | Better |
| 2022 | 36.9% | 63.1% | Better |
| 2021 | 42.5% | 57.5% | Good |
| 2020 | 48.6% | 51.4% | Good |
| 2019 | 52.1% | 47.9% | |
| 2018 | 58.3% | 41.7% | |
| 2017 | 60.8% | 39.2% | |
| 2016 | 64.5% | 35.5% | |
| 2015 | 67.2% | 32.8% | |
| 2014 | 69.6% | 30.4% | |
| 2013 | 71.9% | 28.1% |
Help me understand
Kia Depreciation by Model
Related Articles
Do Electric And Hybrid Cars Hold Their Value?

The 10 Cars, Trucks, and SUVs with the Best Resale Value in 2024

5 Trucks with the Worst Depreciation


