CarEdge saved me over 4,500 dollars on a brand new Honda Pilot. I can't say thank you enough.
Ford Depreciation
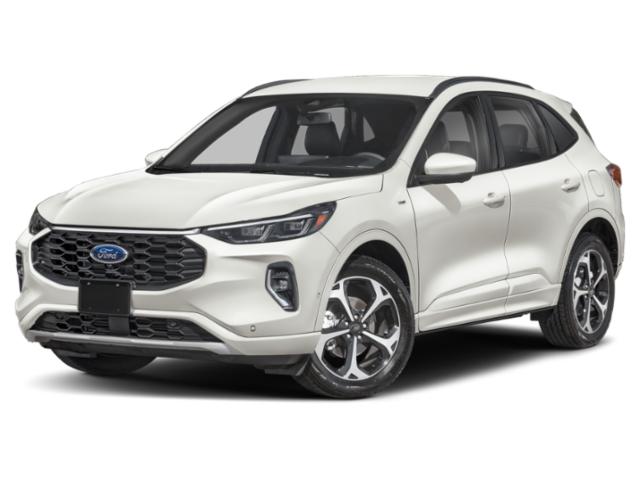
Ford's resale values are all over the map when you look out across the manufacturer's full lineup of vehicles. On the one hand, there's the F-150 and the Mustang, which score very well. On the other hand, there's the Ford Fusion Energi, which simply ran out of steam (or whatever it runs on), and ranks near the bottom with horrible resale values. Ford's SUV lineup (Escape, Explorer, and Expedition) don't put up great numbers, as they all land in the lower 25% of popular models.
2024 is our top pick for the best model year value for Ford vehicles. With the 2024, you would only pay, on average, 73% of the price as new, with 92% of the vehicle's useful life remaining. The 2023 and 2022 model years are also attractive years for the Ford models, and provide a relatively good value. Our rankings consider multiple factors, including original new prices, current prices, maintenance costs and remaining years of overall predictabe expenses. Our top ranked model year represents the most car for the money with a Ford model.
Ford Depreciation
| Year | Depreciation | Residual Value | Percent Left | Value Rating |
|---|---|---|---|---|
| 2025 | 0.0% | 100.0% | 100.0% | |
| 2024 | 26.7% | 73.3% | 91.7% | Best |
| 2023 | 34.0% | 66.0% | 83.3% | Better |
| 2022 | 37.8% | 62.2% | 75.0% | Better |
| 2021 | 42.3% | 57.7% | 66.7% | Good |
| 2020 | 49.9% | 50.1% | 58.3% | Good |
| 2019 | 53.0% | 47.0% | 50.0% | |
| 2018 | 58.5% | 41.5% | 41.7% | |
| 2017 | 62.1% | 37.9% | 33.3% | |
| 2016 | 64.5% | 35.5% | 25.0% | |
| 2015 | 67.1% | 32.9% | 16.7% | |
| 2014 | 69.6% | 30.4% | 8.3% | |
| 2013 | 71.9% | 28.1% | 0.0% |
| Year | Depreciation | Residual Value | Value Rating |
|---|---|---|---|
| 2025 | 0.0% | 100.0% | |
| 2024 | 26.7% | 73.3% | Best |
| 2023 | 34.0% | 66.0% | Better |
| 2022 | 37.8% | 62.2% | Better |
| 2021 | 42.3% | 57.7% | Good |
| 2020 | 49.9% | 50.1% | Good |
| 2019 | 53.0% | 47.0% | |
| 2018 | 58.5% | 41.5% | |
| 2017 | 62.1% | 37.9% | |
| 2016 | 64.5% | 35.5% | |
| 2015 | 67.1% | 32.9% | |
| 2014 | 69.6% | 30.4% | |
| 2013 | 71.9% | 28.1% |
Help me understand
Ford Depreciation by Model
Related Articles
Do Electric And Hybrid Cars Hold Their Value?

The 10 Cars, Trucks, and SUVs with the Best Resale Value in 2024

5 Trucks with the Worst Depreciation


