Electric Vehicle Sales and Market Share (US – 2026 Updates)
Key Takeaways
- Q4 2025 EV market share numbers reflect the drop in buyers following the expiration of federal incentives.
- The only brands with year-over-year gains were Cadillac, Volvo, Jeep, and Lucid.
- Tesla's EV market share climbed from 41% in Q3 to 59% in Q4.
- In 2026, uncertainty is the name of the game when it comes to EV sales in the United States.
As electric cars continue to enter the mainstream, the tug-of-war between EV startups and legacy giants is intensifying. With federal EV tax credits now expired, how will EV sales trend? Will Tesla hold its lead, or will Ford, General Motors and the rest catch up? Bookmark this page for the latest quarterly and monthly sales and market share updates for electric vehicles in the United States.
Q4 2025 Electric Vehicle Market Share and Sales (U.S.)
Q4 2025 EV sales numbers reflect the dip analysts expected following the end of federal EV subsidies in September:
- U.S. EV market share fell to 5.7% in Q4 2025.
- EV sales volume fell to 234,171 fully-electric vehicles sold in the fourth quarter.
- Tesla climbed sharply to 59% of U.S. EV market share, the highest since 2023.
- The only brands with year-over-year gains for Q4 were Cadillac, Volvo, Jeep, and Lucid.
- Among the nearly 90 EV models on sale, only the Tesla Model Y and Model 3 achieved more than 10,000 sales in Q4.
In the fourth quarter of 2025, battery electric vehicle market share was 5.7% of all new car sales in the United States. This is down from 8.7% one year prior, and the all-time high of 10.5% in Q3 2025.
Q4 2025 EV Sales Totals
Here’s how U.S. EV sales totals in Q4 2025 compare to the past three years:
| Automaker | Q1 2022 | Q2 2022 | Q3 2022 | Q4 2022 | Q1 2023 | Q2 2023 | Q3 2023 | Q4 2023 | Q1 2024 | Q2 2024 | Q3 2024 | Q4 2024 | Q1 2025 | Q2 2025 | Q3 2025 | Q4 2025 |
|---|---|---|---|---|---|---|---|---|---|---|---|---|---|---|---|---|
| Tesla (estimate) | 129,743 | 130,047 | 114,000 | 131,574 | 161,630 | 175,262 | 156,621 | 161,375 | 140,187 | 164,264 | 166,923 | 154,900 | 128,100 | 143,535 | 179,525 | 138,000 |
| Ford Motor Company | 6,734 | 15,273 | 18,257 | 20,339 | 10,866 | 14,843 | 20,962 | 25,937 | 20,223 | 23,957 | 23,509 | 30,176 | 22,550 | 16,438 | 30,612 | 14,513 |
| General Motors | 457 | 7,217 | 15,156 | 16,150 | 20,670 | 15,652 | 20,057 | 19,469 | 16,169 | 21,930 | 32,095 | 43,982 | 31,887 | 46,280 | 66,501 | 25,219 |
| Nissan | 4,371 | 3,251 | 1,276 | 3,308 | 5,214 | 4,215 | 6,074 | 5,113 | 5,284 | 7,128 | 10,066 | 8,546 | 6,471 | 9,073 | 3,934 | 577 |
| Volkswagen Group | 7,932 | 8,961 | 11,893 | 15,193 | 15,723 | 13,977 | 20,295 | 20,403 | 13,806 | 11,904 | 11,900 | 9,755 | 19,827 | 11,043 | 37,400 | 4,940 |
| Hyundai Group (incl. Kia) | 15,480 | 17,979 | 9,796 | 9,641 | 14,346 | 21,696 | 30,757 | 25,447 | 22,936 | 37,044 | 29,609 | 39,649 | 22,995 | 21,493 | 48,650 | 14,000 |
| Subaru | 0 | 0 | 0 | 919 | 1,359 | 1,613 | 2,791 | 3,109 | 1,147 | 4,238 | 3,752 | 3,310 | 3,131 | 3,370 | 3,471 | 743 |
| Toyota Motor N.A. | 0 | 0 | 240 | 985 | 1,840 | 2,893 | 4,221 | 5,718 | 3,500 | 11,607 | 6,851 | 6,309 | 7,064 | 5,964 | 5,032 | 4,406 |
| Mercedes-Benz | 2,091 | 1,959 | 2,717 | 5,656 | 5,053 | 9,029 | 10,423 | 10,767 | 12,250 | 9,270 | 9,447 | 3,763 | 3,472 | 4,611 | 5,973 | 2,455 |
| Mazda | 0 | 0 | 0 | 324 | 15 | 51 | 34 | 0 | 0 | 0 | 0 | 0 | 0 | 0 | 0 | 0 |
| BMW Group | 1,171 | 1,082 | 4,337 | 7,099 | 6,585 | 11,990 | 13,594 | 15,364 | 11,455 | 14,081 | 13,028 | 13,876 | 14,234 | 11,094 | 10,950 | 7,888 |
| Jaguar | 0 | 114 | 0 | 298 | 8 | 80 | 86 | 78 | 256 | 1,188 | 779 | 763 | 381 | N/A | N/A | N/A |
| Stellantis | 0 | 0 | 0 | 0 | 0 | 0 | 0 | 0 | 0 | 204 | 235 | 531 | 4,990 | 2,352 | 6,939 | 840 |
| Volvo-Polestar | 3,092 | 4,518 | 3,510 | 5,616 | 5,228 | 7,608 | 7,797 | 6,531 | 3,279 | 2,285 | 3,913 | 3,028 | 2,718 | 2,898 | 3,058 | 2,129 |
| Rivian | 1,227 | 4,467 | 6,584 | 8,054 | 7,946 | 12,640 | 15,564 | 13,553 | 13,588 | 13,790 | 10,018 | 8,503 | 8,640 | 10,599 | 13,201 | 9,745 |
| Lucid | 460 | 482 | 1,398 | 1,060 | 1,368 | 1,659 | 1,618 | 1,512 | 1,967 | 1,855 | 2,781 | 3,099 | 2,400 | 2,635 | 4,078 | 4,330 |
| Vinfast | - | - | - | - | 110 | 740 | 1,159 | 1,120 | 927 | 1,225 | N/A | 1,800 | 525 | N/A | N/A | N/A |
| TOTAL US EV sales | 173,561 | 196,788 | 188,924 | 226,789 | 258,882 | 295,355 | 313,086 | 317,168 | 268,909 | 330,463 | 346,309 | 348,879 | 296,227 | 310,839 | 437,487 | 234,171 |
| Honda Motor Co | 0 | 0 | 0 | 0 | 0 | 0 | 0 | 0 | 0 | 1,873 | 15,291 | 18,838 | 14,374 | 12,278 | 22,236 | 2,704 |
| Additional EV Models | - | - | - | - | - | - | - | - | - | - | - | - | 5,930 | 3,508 | 2,288 | 1,645 |
Data source: Cox Automotive
% EV Market Share By Brand (U.S.)
See the latest Q4 2025 EV market share by automaker below. Calculations are based on sales totals from Cox Automotive.
| Automaker | Q1 2022 | Q2 2022 | Q3 2022 | Q4 2022 | Q1 2023 | Q2 2023 | Q3 2023 | Q4 2023 | Q1 2024 | Q2 2024 | Q3 2024 | Q4 2024 | Q1 2025 | Q2 2025 | Q3 2025 | Q4 2025 |
|---|---|---|---|---|---|---|---|---|---|---|---|---|---|---|---|---|
| Tesla | 74.8 | 66.1 | 60.3 | 58.0 | 62.4 | 59.3 | 50.0 | 50.9 | 52.1 | 49.7 | 48.2 | 44.4 | 43.5 | 46.2 | 40.9 | 58.9 |
| Ford | 4.4 | 7.8 | 9.7 | 9.0 | 4.2 | 5.0 | 6.7 | 8.2 | 7.5 | 7.2 | 8.6 | 8.7 | 7.7 | 5.3 | 7.0 | 6.2 |
| General Motors | 0.3 | 3.7 | 8.0 | 7.2 | 8.0 | 5.3 | 6.1 | 6.1 | 6.0 | 6.6 | 9.3 | 12.6 | 10.8 | 14.9 | 15.2 | 10.8 |
| Nissan | 2.5 | 1.7 | 0.7 | 1.5 | 2.0 | 1.4 | 1.9 | 1.6 | 2.0 | 2.2 | 2.9 | 2.5 | 2.2 | 2.9 | 1.0 | 0.1 |
| Volkswagen Group | 4.6 | 4.6 | 6.3 | 6.7 | 6.1 | 4.8 | 6.5 | 6.4 | 5.1 | 3.6 | 3.4 | 2.8 | 6.7 | 3.6 | 8.5 | 2.1 |
| Hyundai Motor Group (incl. Kia) | 8.9 | 9.1 | 5.2 | 4.3 | 5.6 | 7.3 | 9.9 | 8.0 | 8.5 | 11.2 | 6.8 | 11.4 | 7.8 | 6.9 | 11.1 | 6.0 |
| Mercedes-Benz | 1.2 | 1.0 | 1.4 | 2.5 | 2.0 | 3.1 | 3.3 | 3.4 | 4.6 | 2.8 | 2.7 | 1.2 | 1.2 | 1.5 | 1.4 | 1.0 |
| Mazda | 0.1 | 0.1 | 0.0 | 0.0 | 0.0 | 0.0 | 0.0 | 0.0 | 0.0 | 0.0 | 0.0 | 0.0 | 0.0 | 0.0 | 0.0 | 0.0 |
| Toyota Motor N.A. | 0.0 | 0.0 | 0.0 | 0.4 | 0.7 | 1.0 | 1.3 | 1.8 | 1.3 | 3.5 | 2.0 | 1.8 | 2.4 | 1.9 | 1.1 | 1.9 |
| Subaru | 0.0 | 0.0 | 0.0 | 0.4 | 0.5 | 0.5 | 0.9 | 1.0 | 0.4 | 1.3 | 1.1 | 1.0 | 1.1 | 1.1 | 0.8 | 0.3 |
| BMW | 0.7 | 0.5 | 2.3 | 3.1 | 2.5 | 3.9 | 4.2 | 4.8 | 4.3 | 4.3 | 3.8 | 4.0 | 4.8 | 3.6 | 2.5 | 3.4 |
| Stellantis | 0.0 | 0.0 | 0.0 | 0.0 | 0.0 | 0.0 | 0.0 | 0.0 | 0.0 | 0.0 | 0.0 | 0.1 | 1.7 | 0.8 | 1.6 | 0.4 |
| Jaguar | 0.1 | 0.1 | 0.0 | 0.0 | 0.0 | 0.0 | 0.0 | 0.0 | 0.0 | 0.4 | 0.2 | 0.2 | 0.1 | 0.0 | 0.0 | 0.0 |
| Rivian | 0.7 | 2.3 | 3.5 | 3.1 | 3.1 | 4.3 | 5.0 | 4.3 | 5.1 | 4.2 | 2.9 | 2.4 | 2.9 | 3.4 | 3.0 | 4.2 |
| Lucid | 0.3 | 0.2 | 0.7 | 0.5 | 0.5 | 0.6 | 0.5 | 0.5 | 0.7 | 0.6 | 0.8 | 0.9 | 0.8 | 0.8 | 0.9 | 1.8 |
| Vinfast | 0.0 | 0.0 | 0.0 | 0.0 | 0.0 | 0.3 | 0.4 | 0.4 | 0.3 | 0.3 | 0.0 | 0.5 | 0.1 | 0.1 | 0.0 | 0.0 |
| Volvo/Polestar | 1.9 | 2.3 | 1.9 | 1.6 | 2.0 | 2.6 | 2.5 | 2.1 | 1.2 | 0.7 | 1.1 | 0.9 | 1.0 | 0.9 | 0.7 | 0.9 |
| Honda Motor Co | 0.0 | 0.0 | 0.0 | 0.0 | 0.0 | 0.0 | 0.0 | 0.0 | 0.0 | 0.5 | 4.4 | 5.4 | 4.8 | 4.0 | 5.1 | 1.2 |
| Other EV Sales | - | - | - | - | - | - | - | - | - | - | - | - | 2.0 | 2.0 | 0.5 | 0.7 |
Data source: Cox Automotive
After several consecutive quarters of decline, Tesla’s share of U.S. EV sales jumped to 59% in Q4 2025. Tesla remains the dominant player in an increasingly crowded field. According to analyses by Cox Automotive, Tesla sales accounted for 45% of all new EV sales in 2026, down slightly from 49% in 2024. At the start of 2022, Tesla had a 75% EV market share in America.
After EV sales sunk in the fourth quarter for Ford and Hyundai Motor Group, General Motors is now firmly in second place. In 2026, Ford is pulling back on EVs, and GM isn’t planning any product launches. Toyota and Subaru, on the other hand, are launching several new models early this year. Will Toyota catch up to the leading legacy automakers? We’ll see how sales trend in the first quarter of 2026.
Historical Data
| Q1 2023 | Q2 2023 | Q3 2023 | Q4 2023 | Q1 2024 | Q2 2024 | Q3 2024 | Q4 2024 | Q1 2025 | Q2 2025 | Q3 2025 | Q4 2025 | |
|---|---|---|---|---|---|---|---|---|---|---|---|---|
| Battery Electric Vehicles (BEV) | 7.3% | 7.2% | 7.9% | 8.1% | 7.3% | 8.0% | 8.9% | 8.7% | 7.5% | 7.4% | 10.5% | 5.7% |
| Electrified (HEV, PHEV, BEV) | 14.5% | 16.0% | 17.7% | 16.0% | 17.8% | 19.1% | 21.2% | 30.7% | TBD | TBD | TBD | TBD |
In 2024, the US EV market share reached 8.1% of all light vehicle sales, up from 7.3% of sales in 2023. In 2022, 5.8% of the new cars Americans bought were fully electric, which was a sharp increase from 3.2% in 2021.
According to EIA.gov, Combined sales of hybrid vehicles, plug-in hybrids, and battery electric vehicles in the United States rose to 16.3% of total new light-duty vehicle sales in 2023. In 2022, hybrid, plug-in hybrid, and BEV sales were 12.9% of total sales.
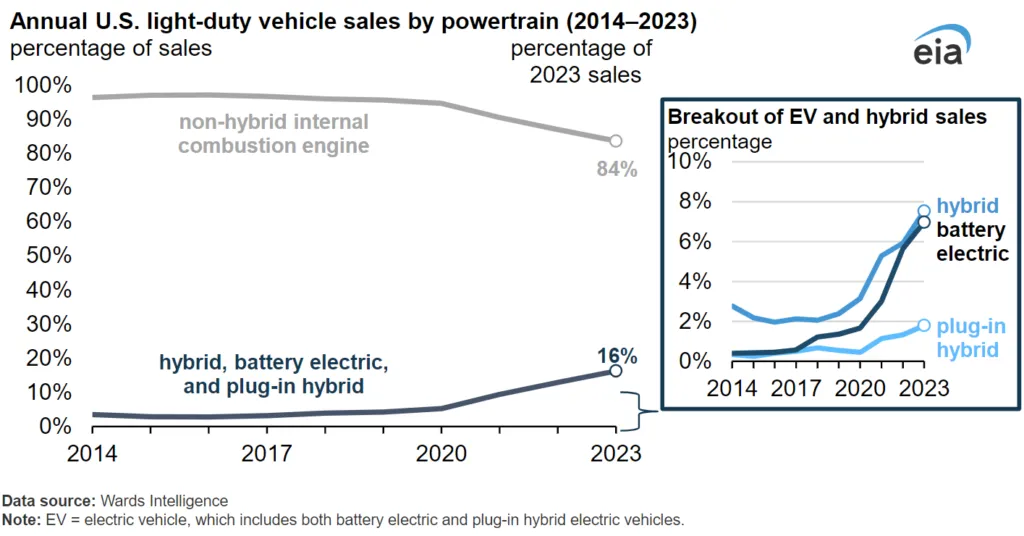
Electrified powertrains continue to see rapid growth, despite less growth in the electric-only segment.
Sponsored by Insurify
Are you overpaying for car insurance?
Compare rates from top carriers in under 5 minutes. CarEdge users save an average of $996/year on auto insurance.
*Disclosure: CarEdge may earn a commission when you compare insurance quotes through our partner, Insurify. This does not influence our editorial content.*