CarEdge saved me over 4,500 dollars on a brand new Honda Pilot. I can't say thank you enough.
Audi Depreciation
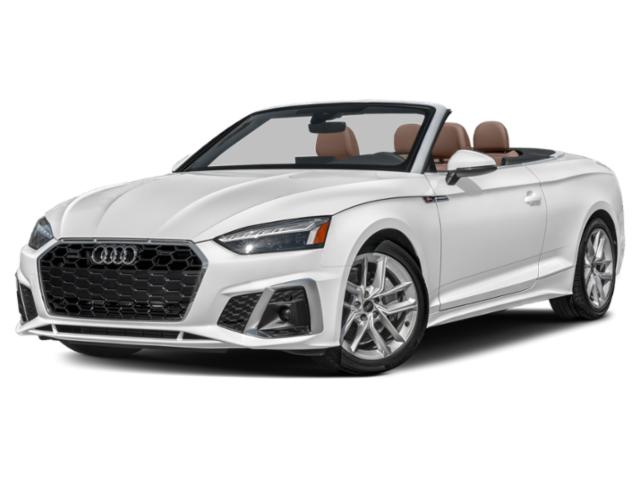
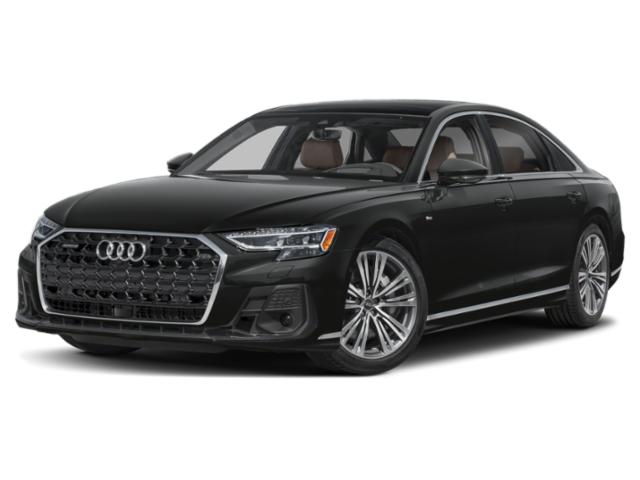
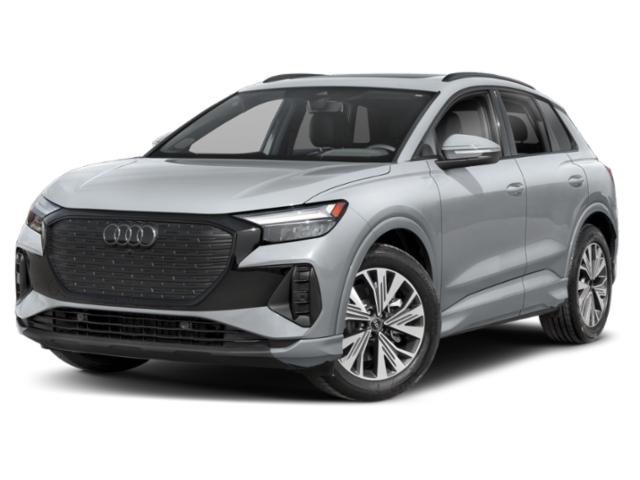
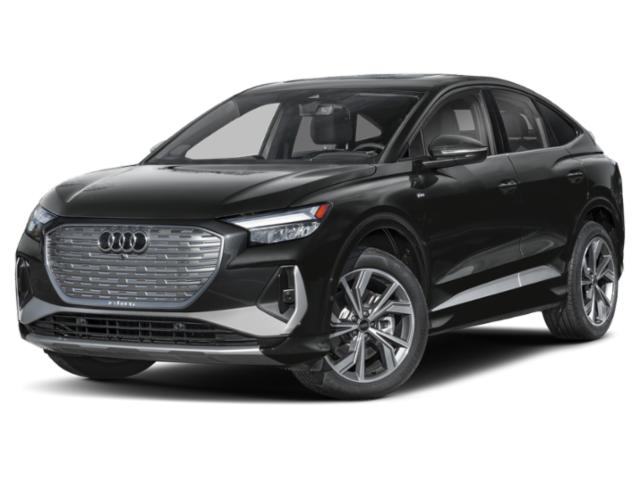
The Audi brand consistently ranks near the top for value retention in the luxury segment. But it is the sportier models in the S4, S6 and TTS that fare better than their more traditional and more pedestrian brethren, the A4, A6 and A8, with the Q series lineup falling in between. Consistent with the sport theme, it is the Audi R8 and TTS that have performed extremely well over the 7-year holding period, showing that even supercars can hold their value, if they have the formula right-which Audi has with their R8.
2023 is our top pick for the best model year value for Audi vehicles. With the 2023, you would only pay, on average, 71% of the price as new, with 83% of the vehicle's useful life remaining. The 2024 and 2022 model years are also attractive years for the Audi models, and provide a relatively good value. Our rankings consider multiple factors, including original new prices, current prices, maintenance costs and remaining years of overall predictabe expenses. Our top ranked model year represents the most car for the money with a Audi model.
Audi Depreciation
| Year | Depreciation | Residual Value | Percent Left | Value Rating |
|---|---|---|---|---|
| 2025 | 0.0% | 100.0% | 100.0% | |
| 2024 | 20.0% | 80.0% | 91.7% | Better |
| 2023 | 29.1% | 70.9% | 83.3% | Best |
| 2022 | 35.6% | 64.4% | 75.0% | Better |
| 2021 | 42.7% | 57.3% | 66.7% | Good |
| 2020 | 47.7% | 52.3% | 58.3% | Good |
| 2019 | 54.7% | 45.3% | 50.0% | |
| 2018 | 60.1% | 39.9% | 41.7% | |
| 2017 | 64.5% | 35.5% | 33.3% | |
| 2016 | 68.1% | 31.9% | 25.0% | |
| 2015 | 70.5% | 29.5% | 16.7% | |
| 2014 | 72.7% | 27.3% | 8.3% | |
| 2013 | 74.8% | 25.2% | 0.0% |
| Year | Depreciation | Residual Value | Value Rating |
|---|---|---|---|
| 2025 | 0.0% | 100.0% | |
| 2024 | 20.0% | 80.0% | Better |
| 2023 | 29.1% | 70.9% | Best |
| 2022 | 35.6% | 64.4% | Better |
| 2021 | 42.7% | 57.3% | Good |
| 2020 | 47.7% | 52.3% | Good |
| 2019 | 54.7% | 45.3% | |
| 2018 | 60.1% | 39.9% | |
| 2017 | 64.5% | 35.5% | |
| 2016 | 68.1% | 31.9% | |
| 2015 | 70.5% | 29.5% | |
| 2014 | 72.7% | 27.3% | |
| 2013 | 74.8% | 25.2% |
Help me understand
Audi Depreciation by Model
Related Articles
Do Electric And Hybrid Cars Hold Their Value?

The 10 Cars, Trucks, and SUVs with the Best Resale Value in 2024

5 Trucks with the Worst Depreciation


