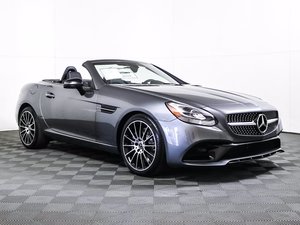
Mercedes-Benz Depreciation
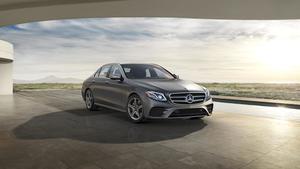
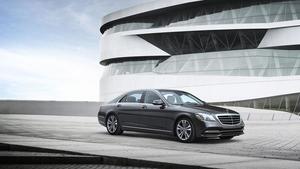
Mercedes' resale values span a wide range, with some models holding their values well, and others taking a big hit early, and continuing to fall. For Mercedes, it's all about what's in "vogue" today, and what styles are deemed attractive, as if you're buying a suit or dress. Currently, the SL and S-Class sedans are not sought after, and their resale values reflect that. Alternatively, the "G-Wagon" and its odd combination of polarizing-looks-meets-status-symbol seems to be more resilient to fashion trends, as it rank very well within its peer group for retaining value.
The 2019 is our top pick for the best model year value for the Mercedes-Benz vehicles. With the 2019, you would only pay, on average, 68% of the price as new, with 75% of the vehicle's useful life remaining. The 2021 and 2020 model years are also attractive years for the Mercedes-Benz models, and provide a relatively good value. Our rankings consider multiple factors, including original new prices, current prices, maintenance costs and remaining years of overall predictabe expenses. Our top ranked model year represents the most car for the money with a Mercedes-Benz model.
Mercedes-Benz Depreciation
| Year | Depreciation | Residual Value | Percent Left | Value Rating |
|---|---|---|---|---|
| 2022 | 0.00% | 100.00% | 100.00% | |
| 2021 | 12.12% | 87.88% | 91.67% | Better |
| 2020 | 22.02% | 77.98% | 83.33% | Better |
| 2019 | 32.38% | 67.62% | 75.00% | Best |
| 2018 | 36.69% | 63.31% | 66.67% | Good |
| 2017 | 44.75% | 55.25% | 58.33% | Good |
| 2016 | 51.95% | 48.05% | 50.00% | |
| 2015 | 56.10% | 43.90% | 41.67% | |
| 2014 | 61.03% | 38.97% | 33.33% | |
| 2013 | 67.64% | 32.36% | 25.00% | |
| 2012 | 69.31% | 30.69% | 16.67% | |
| 2011 | 72.83% | 27.17% | 8.33% | |
| 2010 | 76.35% | 23.65% | 0.00% |
| Year | Depreciation | Residual Value | Value Rating |
|---|---|---|---|
| 2022 | 0.00% | 100.00% | |
| 2021 | 12.12% | 87.88% | Better |
| 2020 | 22.02% | 77.98% | Better |
| 2019 | 32.38% | 67.62% | Best |
| 2018 | 36.69% | 63.31% | Good |
| 2017 | 44.75% | 55.25% | Good |
| 2016 | 51.95% | 48.05% | |
| 2015 | 56.10% | 43.90% | |
| 2014 | 61.03% | 38.97% | |
| 2013 | 67.64% | 32.36% | |
| 2012 | 69.31% | 30.69% | |
| 2011 | 72.83% | 27.17% | |
| 2010 | 76.35% | 23.65% |
