Toyota Prices Have Increased 19% In 5 Years
Key Takeaways
- Toyota prices have increased 19% since 2018.
- Over the same period, Toyota’s US sales have fallen 10%.
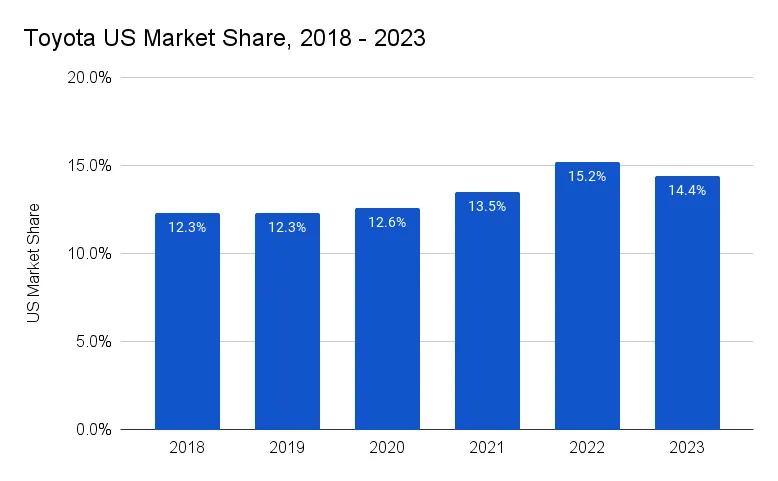
- US market share peaked at 15.5% in 2022, but fell last year.
Toyota prices have risen 19% since 2018. Today, Toyota MSRPs are $6,124 higher on average. It’s true that Toyota prices haven’t climbed as drastically as other car brands (notably Jeep), but the price hikes still exceed historical norms for car price inflation. Overall, new car prices in America have risen 28% over the same period.
Could Toyota’s rising prices be to blame for the brand’s declining sales? Is the brand pricing for a market that’s simply too premium for Toyota’s reputation? Which Toyota prices have risen the most? We’ll answer these questions and more. Plus, we’ll take a closer look at Toyota’s best-selling models.
Jeep’s Sales Fall 34% As Prices Rise
I think most automotive analysts would agree that Toyota Motor North America (TMNA) is doing just fine these days. Revenue and profits were both higher in 2023. But it’s not all good news, even as the brand has reached record market share.
Toyota’s US sales have been struggling to climb for most of the past five years. Yes, there was the pandemic and the ensuing parts shortage. Japanese automakers were hit particularly hard by the semiconductor chip shortage of 2021-early 2022. But even in 2023, the closest year we’ve had to a ‘normal’ year in a while, Toyota’s sales were essentially flat, and market share fell from 2022’s highs.
Toyota reported sales dropping from 2,128,263 in 2018 to 1,928,228 cars sold in 2023. For the first time in several years, Toyota’s market share in America fell in 2023.
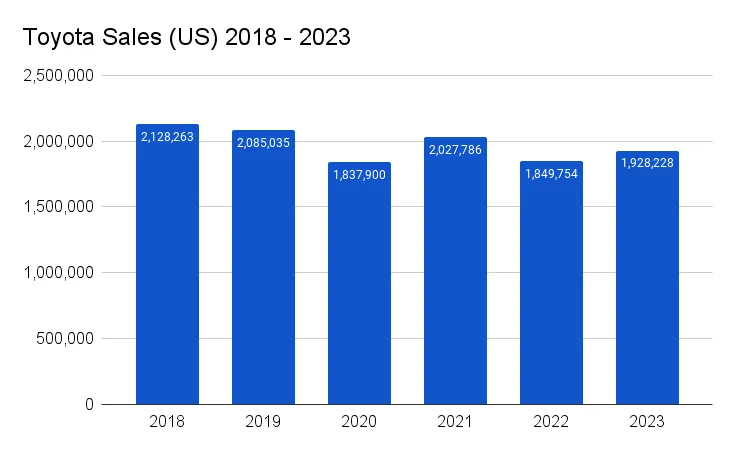
Over the same period, Toyota’s average transaction price rose from $32,168 in 2018 to $38,298 in 2023, a price increase of 19 percent.
Toyota’s U.S. market share was steadily climbing as the brand conquered competitors like Chevrolet, Ford, and even Honda to an extent. That all ended in 2023, when Toyota’s market share took a slight dip. The leading theory for why this happened is that Hyundai and Kia’s rising popularity are a force to be reckoned with.
Could rising prices be to blame for stagnant sales, or is Toyota facing more competition from the likes of Kia and Hyundai? It’s likely a combination of these and other factors. Let’s take a look at Toyota’s average selling prices over time. We’ve also included the overall market trends for comparison’s sake.
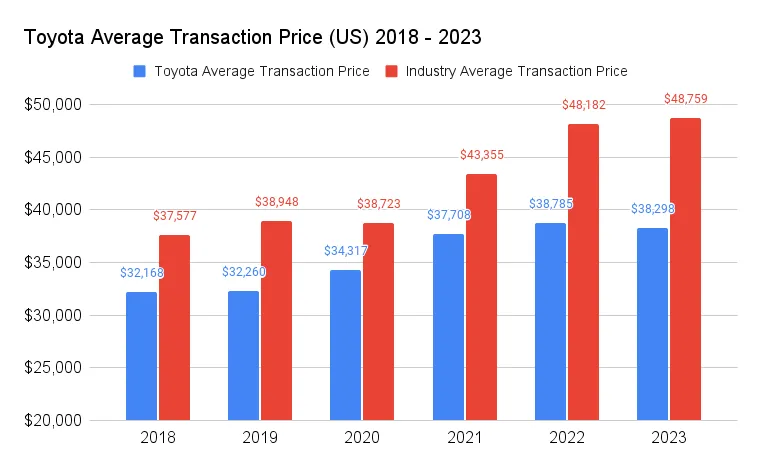
Inflation is hitting everyone, including OEMs like Toyota. Clearly, Toyota has shielded their customers from the worst of car price inflation when compared to the industry average. Nevertheless, Toyota prices are climbing.
There’s another reality that has undoubtedly played into Toyota’s rising prices. As more buyers choose SUVs, crossovers, and even trucks (as is the trend these days), naturally, average transaction prices will rise. Larger vehicles almost always cost more than sedans.
Now, let’s look at how Toyota’s five best-selling models in America have fared when it comes to sales and price trends.
Toyota RAV4
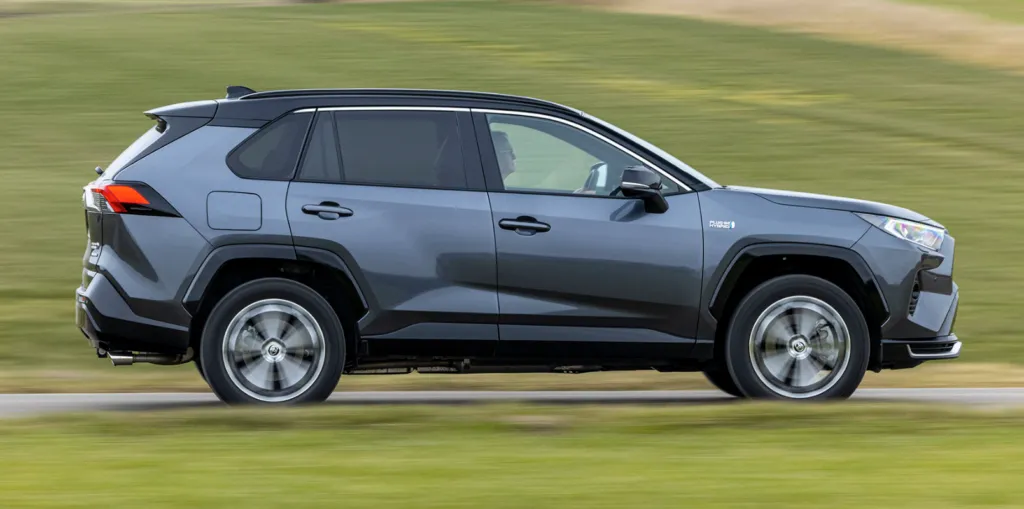
Last year, Toyota sold 434,943 RAV4’s in America. That’s up 8.8% from 2022. However, RAV4 prices have risen 11% in the past five years. Here’s a look at RAV4 price trends over the past five model years, with a breakdown showing the base model, mid-spec, and top-trim prices over time.
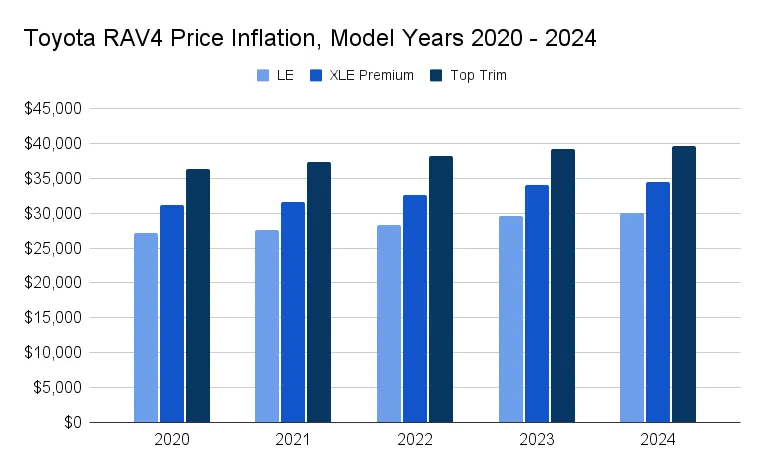
In 2024, CarEdge Data shows that the average transaction price for a new Toyota RAV4 is $37,053.
Browse Toyota RAV4 listings with the power of local market data.
Toyota Camry
Last year, Toyota sold 290,649 Camry’s in America. That’s up 1.5% from 2022. However, Camry prices have risen 6% in just five years. Here’s a look at Camry price trends over the past five model years, with a breakdown showing the base model, mid-spec, and top-trim prices over time.
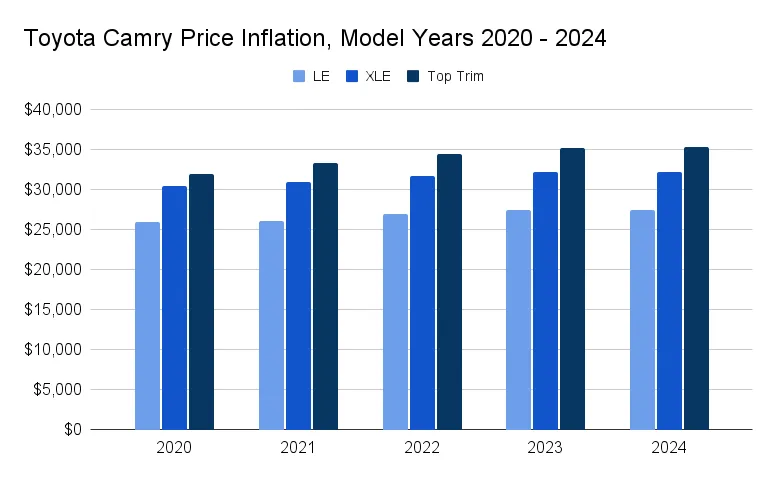
In 2024, CarEdge Data shows that the average transaction price for a new Toyota Camry is $32,256.
Browse Toyota Camry listings with the power of local market data.
Toyota Corolla
Last year, Toyota sold 232,370 Corolla’s in America. US Corolla sales were up 4.5% year-over-year in 2023. However, Corolla prices have risen 12% in just five years. Here’s a look at Corolla price trends over the past five model years, with a breakdown showing the base model, mid-spec, and top-trim prices over time.
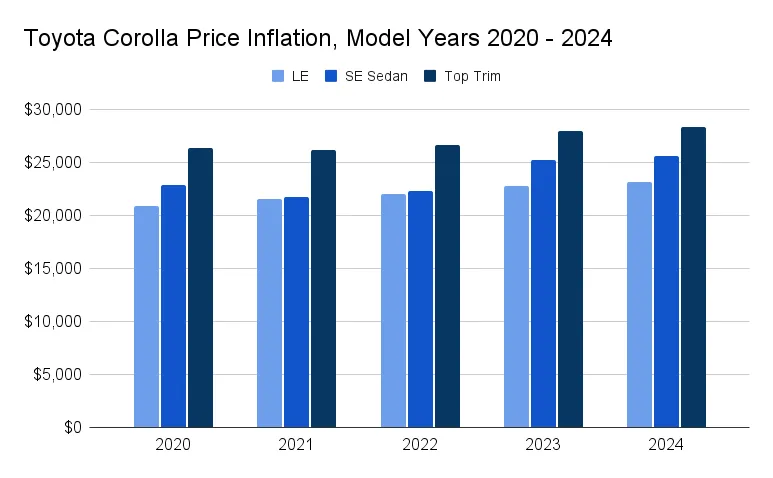
In 2024, CarEdge Data shows that the average transaction price for a new Toyota Corolla is $25,169.
Browse Toyota Corolla listings with the power of local market data.
Toyota Tacoma
Last year, Toyota sold 234,768 Tacoma’s in America. Tacoma sales were DOWN 1.1% year-over-year in 2023. However, rising prices could be to blame. Tacoma prices have risen 20.6% in five years. Here’s a look at Tacoma price trends over the past five model years, with a breakdown showing the base model, mid-spec, and top-trim prices over time.
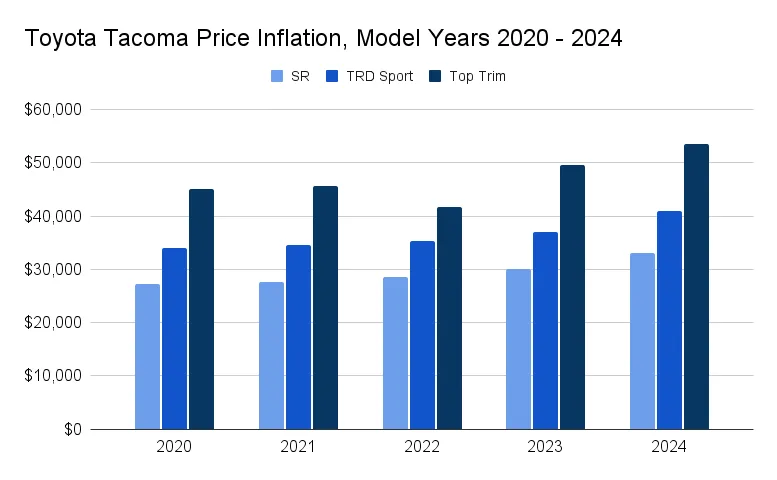
In 2024, CarEdge Data shows that the average transaction price for a new Toyota Tacoma is $41,196.
Browse Toyota Tacoma listings with the power of local market data.
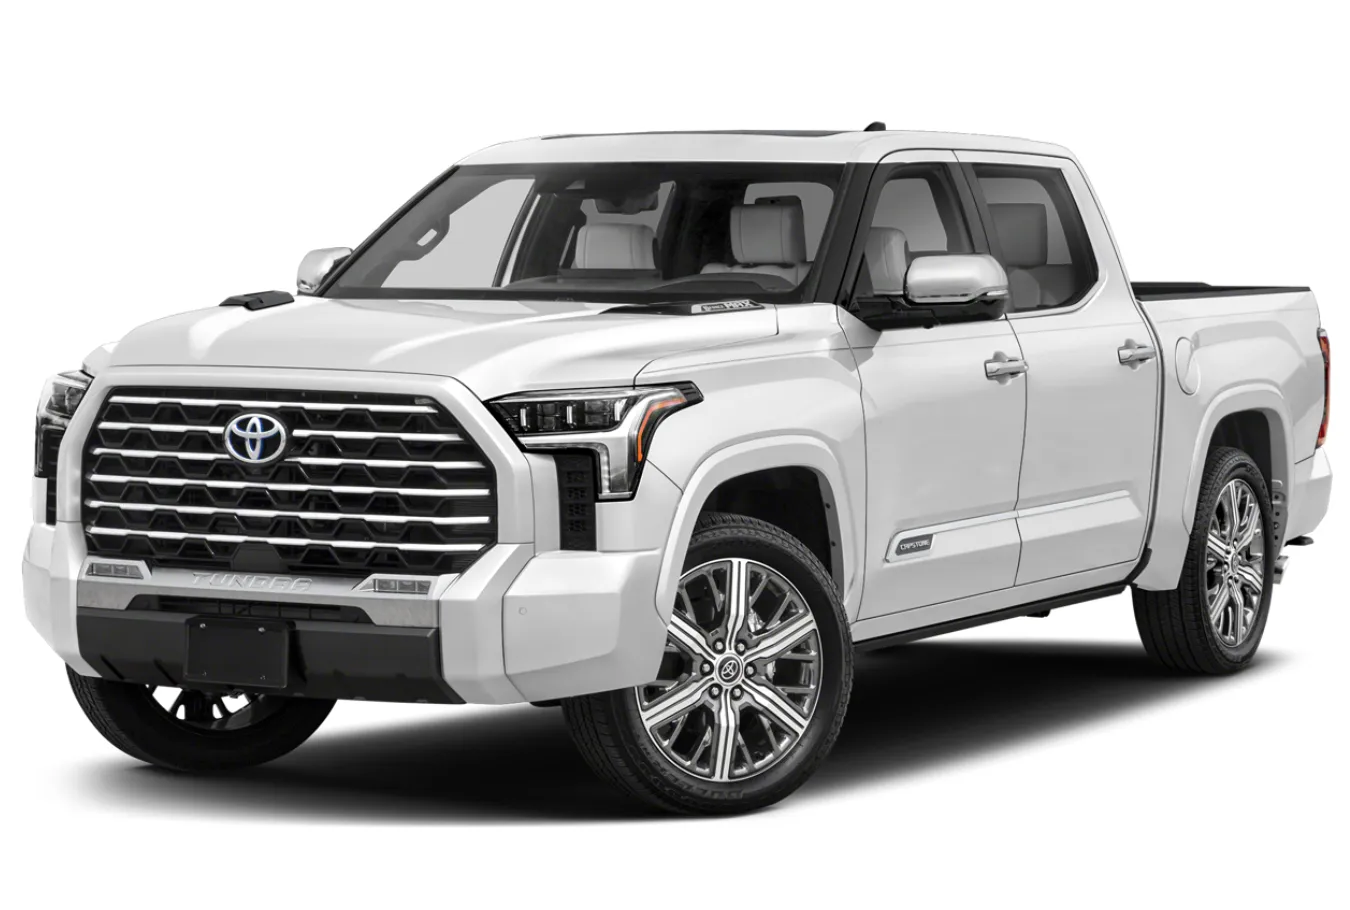
Toyota Tundra
Last year, Toyota sold 125,185 Tundra’s in America. Tundra sales were up 20% year-over-year in 2023. Tundra prices have risen 26.3% in just five years, the biggest price increase of any Toyota model. Looking at sales stats, truck buyers don’t seem to mind. Here’s a look at Toyota Tundra price trends over the past five model years, with a breakdown showing the base model, mid-spec, and top-trim prices over time.
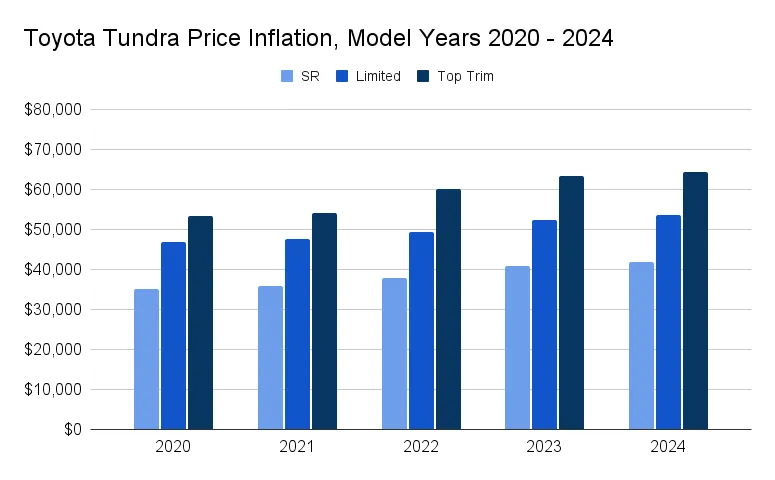
In 2024, CarEdge Data shows that the average transaction price for a new Toyota Tundra is $64,191.
Browse Toyota Tundra listings with the power of local market data.
Be sure to check back for the latest Toyota price data next month. In 2024, it’s a buyer’s market for the first time since the pandemic.
Looking to Save Thousands On Your Toyota Purchase? We Can Help.
Who is CarEdge? Simply put, we’re a team of real people saving drivers serious money. How do we do it? We offer car buying help for every price point. From 100% free resources to an all-inclusive car buying concierge, and everything in between, CarEdge is taking the pain out of car buying.
How about some free car buying help…

Ready to outsmart the dealerships? Download your 100% free car buying cheat sheets today. From negotiating a deal to leasing a car the smart way, it’s all available for instant download. Get your cheat sheets today!
Sponsored by Insurify
Are you overpaying for car insurance?
Compare rates from top carriers in under 5 minutes. CarEdge users save an average of $996/year on auto insurance.
*Disclosure: CarEdge may earn a commission when you compare insurance quotes through our partner, Insurify. This does not influence our editorial content.*