CarEdge saved me over 4,500 dollars on a brand new Honda Pilot. I can't say thank you enough.
Cars with the Best Resale After 7 Years
Depreciation in vehicles is virtually unavoidable. Recognizing this, we wanted to provide you with the good, the bad, and the ugly when it comes to those vehicles that perform well in holding their value - and equally so, those that don't. Most auto research sites have to be careful in what they publish in order to not upset their dealer customers, and with such, they will just show you the good news. We, on the other hand, provide you the entire list, from best to worst, with more than 200 vehicle makes and models ranked semi-annually.
Best Brands for Resale Value After 7 Years
Brands with the Best Resale After 7 Years
| Rank | Brand | 7 Year Resale Value |
|---|---|---|
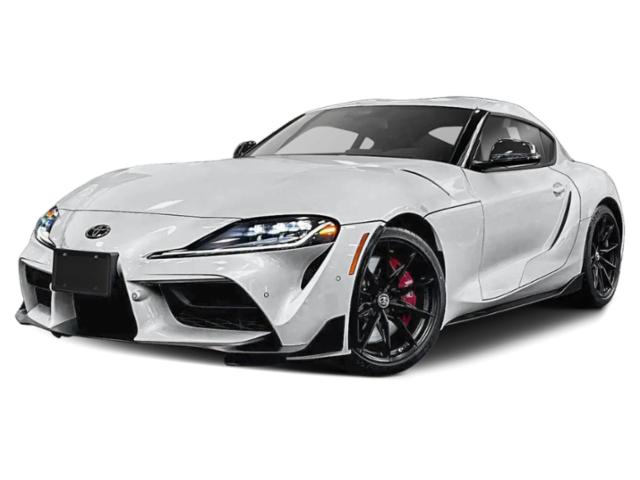
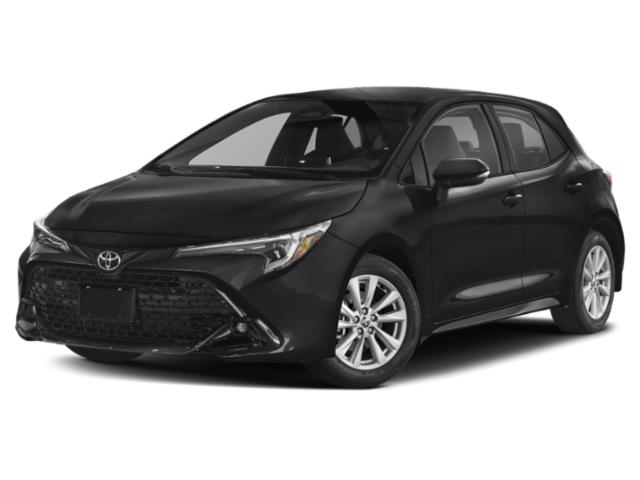
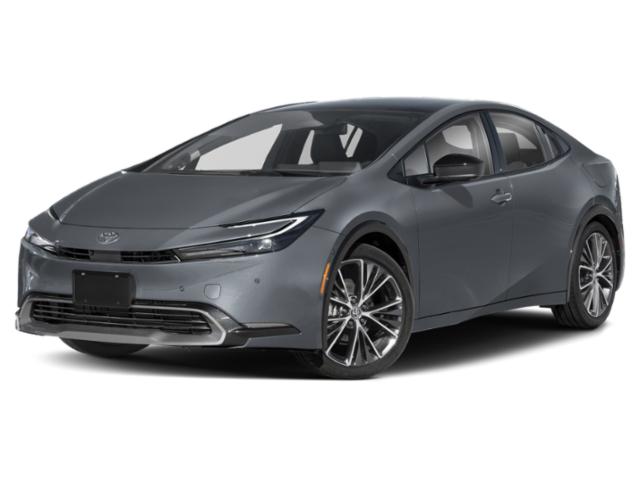
| 1 | Toyota | 56.90% |
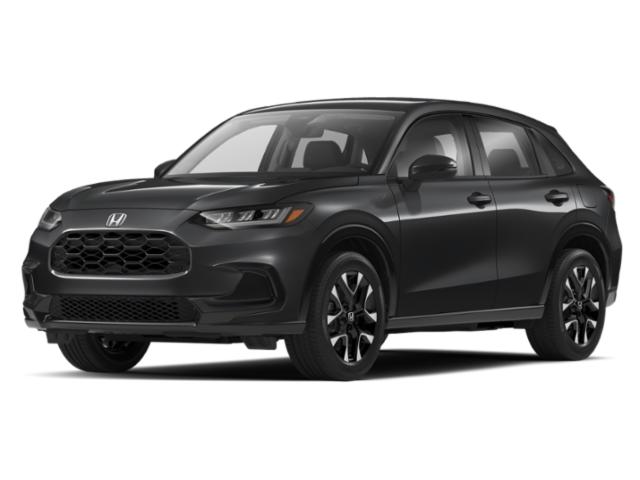
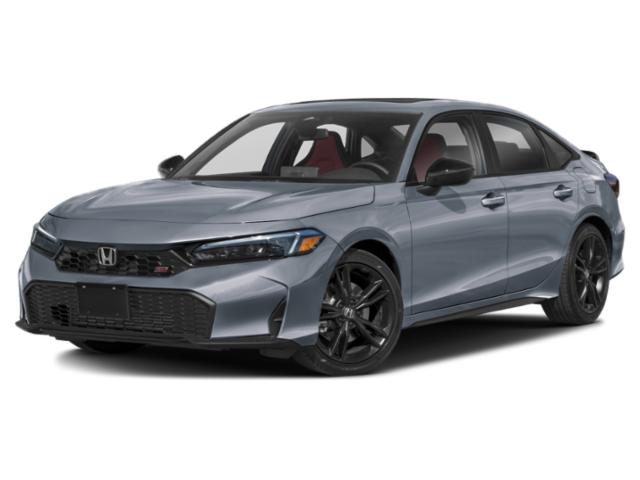
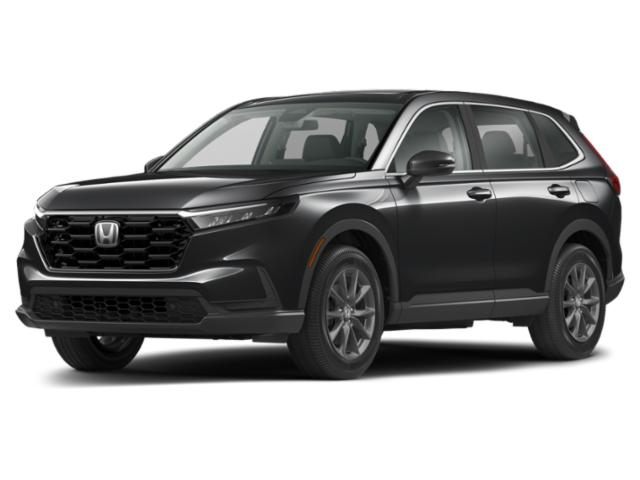
| 2 | Honda | 52.90% |
| 3 | Subaru | 52.50% |
| 4 | Mazda | 51.00% |
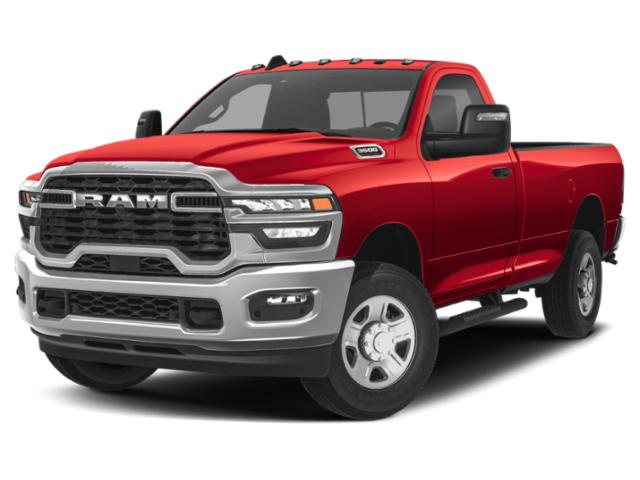
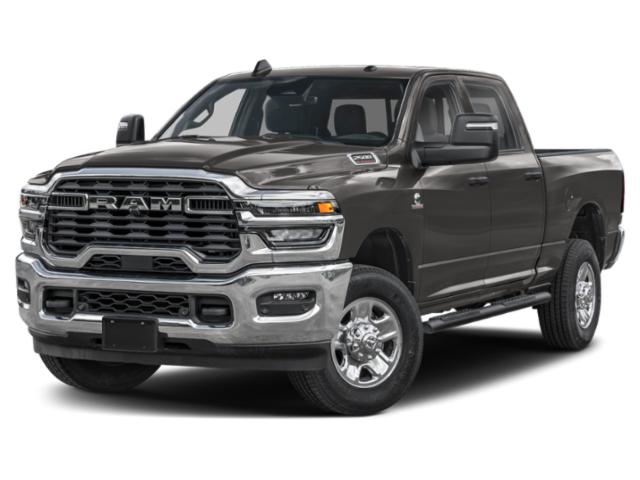
| 5 | RAM | 50.40% |
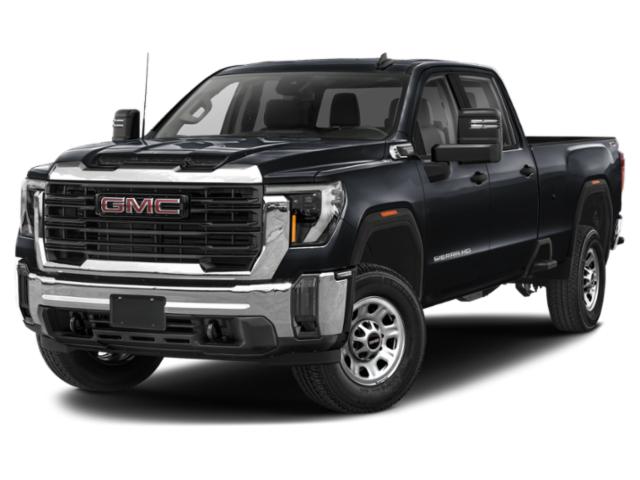
| 6 | GMC | 46.60% |
| 7 | MINI | 46.10% |
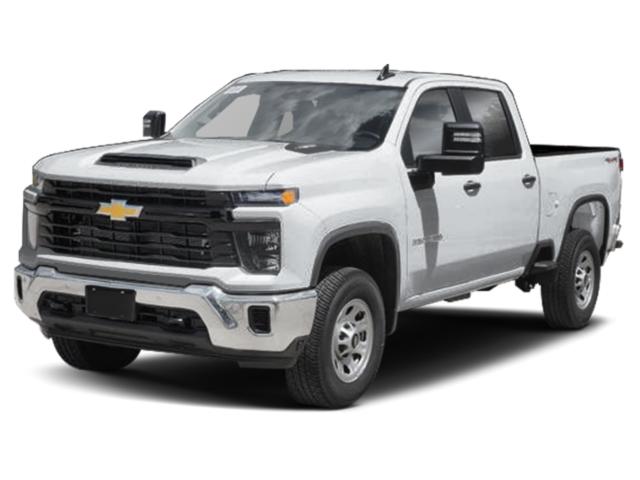
| 8 | Chevrolet | 42.80% |
| 9 | Hyundai | 42.80% |
| 10 | Jeep | 42.10% |
| 11 | Volkswagen | 42.10% |
| 12 | Kia | 41.70% |
| 13 | Ford | 41.50% |
| 14 | Mitsubishi | 41.20% |
| 15 | Nissan | 40.60% |
| 16 | Dodge | 36.00% |
| 17 | Buick | 35.40% |
| 18 | Chrysler | 32.40% |
| 19 | FIAT | 30.60% |


