Beat the tariffs without lifting a finger with 25% off our Car Buying Services

Cars with the Worst Resale After 7 Years

Depreciation in vehicles is virtually unavoidable. Recognizing this, we wanted to provide you with the good, the bad, and the ugly when it comes to those vehicles that perform well in holding their value - and equally so, those that don't. Most auto research sites have to be careful in what they publish in order to not upset their dealer customers, and with such, they will just show you the good news. We, on the other hand, provide you the entire list, from best to worst, with more than 200 vehicle makes and models ranked semi-annually.

Worst Brands for Resale Value After 7 Years

Dodge's value retention can best be described as "average", although they do better at the 5-year mark. Read our analysis and view the Dodge depreciation curve here.
Chrysler struggles in the area of resale value, ranking near the bottom of the list for the 3-, 5- and 7-year time periods. Read our analysis and view the Chrysler depreciation curve here.
The Fiat 500 was cute when it entered the market with its high-profile celebrity endorsements, but that hasn't done the car any favors in the used vehicle market, as their resale value has fallen considerably. Read our analysis and view the FIAT depreciation curve here.
Buy a new Buick, only if you want to say, "our family has always owned Buicks". Read our analysis and view the Buick depreciation curve here.
When looking at Jeep resale values, it really depends on which Jeep you are looking to purchase. Read our analysis and view the Jeep depreciation curve here.

Brands with the Worst Resale After 7 Years

Rank Brand 7 Year Resale Value
19 Dodge 30.20%
18 Chrysler 33.40%
17 FIAT 35.40%
16 Buick 37.50%
15 Jeep 39.60%
14 Nissan 41.90%
13 Volkswagen 41.90%
12 Chevrolet 42.00%
11 Ford 42.20%
10 Kia 43.10%
9 Hyundai 45.10%
8 MINI 46.20%
7 GMC 46.30%
6 Mitsubishi 46.90%
5 RAM 48.70%
4 Subaru 51.00%
3 Mazda 51.90%
2 Honda 53.30%
1 Toyota 54.60%

Worst Cars for Resale Value After 7 Years

Cars with the Worst Resale After 7 Years

Rank Model 7 Year Residual Value
185 Toyota Mirai 14.3%
184 Jeep Grand Cherokee 27.4%
183 Nissan Armada 28.5%
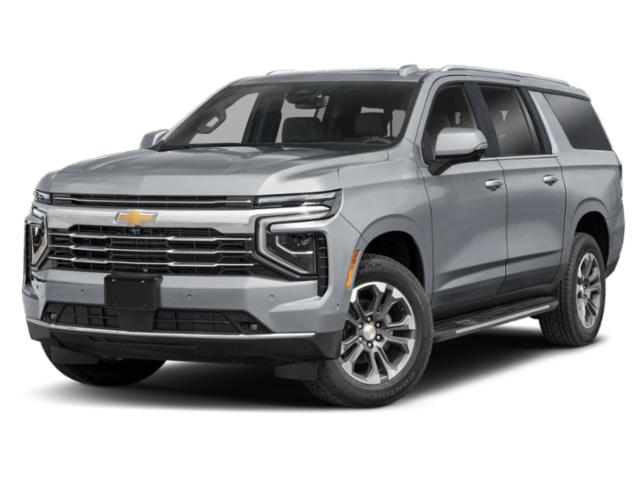
182 Chevrolet Suburban 28.7%
181 Dodge Durango 30.2%
180 Dodge Hornet 30.2%
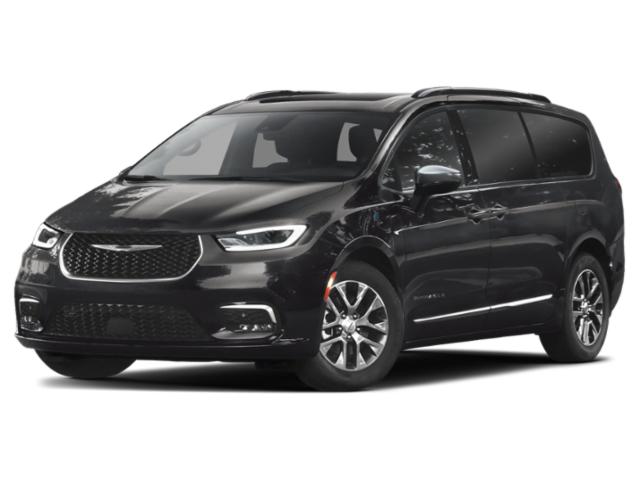
179 Chrysler Voyager 30.7%
178 Nissan ARIYA 30.9%
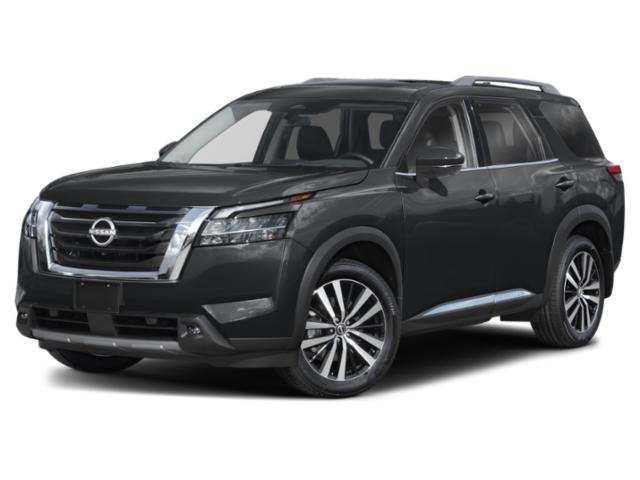
177 Nissan Pathfinder 31.6%
176 Ford Expedition 32.3%
175 Kia Sorento 33.4%
174 Jeep Wrangler 4xe 33.8%
173 Volkswagen ID.4 33.9%
172 Nissan LEAF 34.2%
171 Subaru Solterra 34.5%
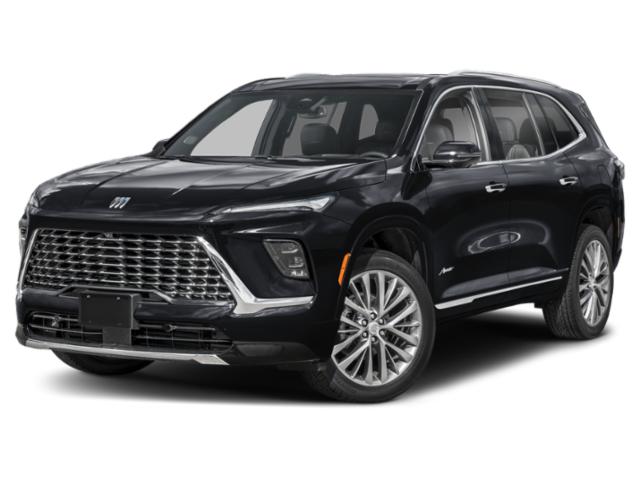
170 Buick Enclave 34.6%
169 FIAT 500e 35.4%
168 Hyundai Kona Electric 35.7%
167 Ford Explorer 35.8%
166 GMC Yukon XL 36.0%
165 Chrysler Pacifica 36.0%
164 Chevrolet Traverse 36.2%
163 Jeep Grand Cherokee L 36.3%
162 Volkswagen Atlas 36.4%
161 GMC Acadia 36.5%
160 Toyota bZ4X 36.5%
159 Ford Bronco 36.6%
158 Ford Mustang Mach-E 36.6%
157 Ford Bronco Sport 36.6%
156 Kia EV6 36.7%
155 Nissan Altima 36.7%
154 Hyundai IONIQ 6 36.9%
153 Hyundai IONIQ 5 37.1%
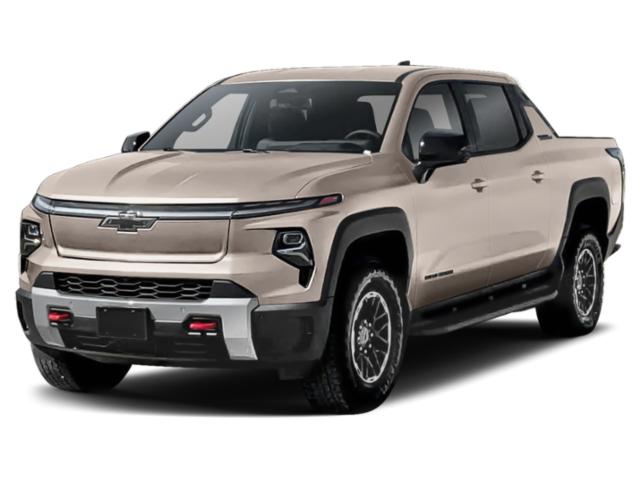
152 Chevrolet Silverado EV 37.2%
151 Nissan Murano 37.2%
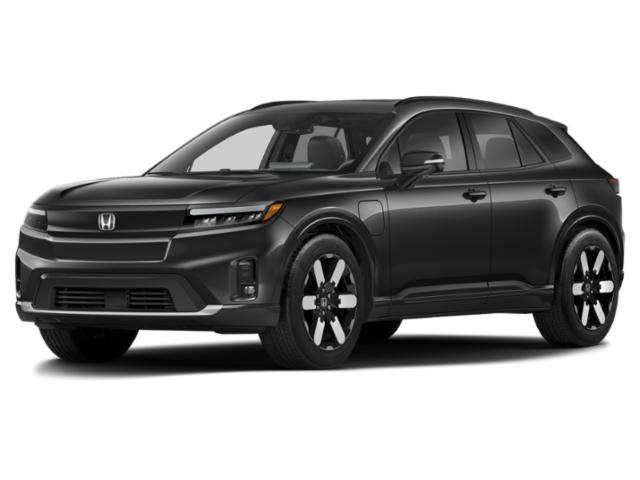
150 Honda Prologue 37.4%
149 Buick Encore GX 37.5%
148 Buick Envista 37.5%
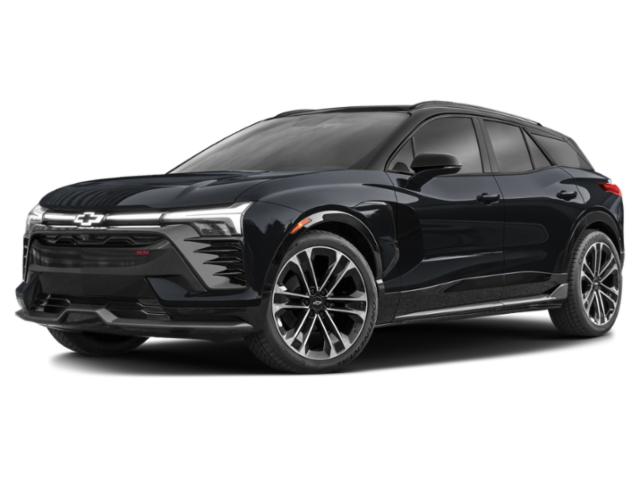
147 Chevrolet Blazer EV 37.6%
146 Chevrolet Blazer 37.6%
145 Chevrolet Equinox EV 37.6%
144 Chevrolet Trailblazer 37.6%
143 Jeep Grand Wagoneer 37.7%
142 Ford F-150 Lightning 37.9%
141 Jeep Grand Wagoneer L 38.1%
140 Jeep Wrangler 38.6%
139 Jeep Wagoneer 38.9%
138 Volkswagen ID. Buzz 39.1%
137 Volkswagen Atlas Cross Sport 39.1%
136 Ford Escape 39.1%
135 Volkswagen Taos 39.1%
134 GMC HUMMER EV SUV 39.2%
133 Ford Edge 39.3%
132 Nissan Versa 39.3%
131 Mitsubishi Outlander 39.6%
130 Chevrolet Tahoe 39.8%
129 Chevrolet Corvette Z06 40.3%
128 Chevrolet Corvette Stingray 40.3%
127 Buick Envision 40.4%
126 Chevrolet Equinox 40.5%
125 Volkswagen Arteon 40.8%
124 Kia EV9 41.0%
123 Kia Telluride 41.0%
122 Kia Seltos 41.0%
121 Hyundai Santa Fe 41.2%
120 Ford Mustang 41.3%
119 Ford F-150 41.4%
118 Ford Ranger 41.4%
117 Ford Maverick 41.4%
116 GMC Yukon 41.5%
115 Nissan TITAN XD 41.5%
114 Kia Sportage 41.5%
113 Volkswagen Tiguan 41.7%
112 Nissan Sentra 41.8%
111 Chevrolet Camaro 42.0%
110 Jeep Wagoneer L 42.4%
109 Jeep Wagoneer S 42.4%
108 GMC Terrain 42.9%
107 Chevrolet Trax 42.9%
106 MINI Convertible 43.4%
105 Mitsubishi Outlander Sport 43.4%
104 Nissan Rogue 43.5%
103 Mitsubishi Eclipse Cross 43.5%
102 MINI Countryman 43.6%
101 GMC Sierra 1500 43.8%
100 Chevrolet Malibu 44.0%
99 Toyota Crown 44.1%
98 Honda Pilot 44.1%
97 Subaru Ascent 44.1%
96 Nissan TITAN 44.4%
95 Toyota Sienna 45.4%
94 Honda Odyssey 45.4%
93 Kia Carnival MPV 45.4%
92 Hyundai Sonata 45.5%
91 Subaru Outback 45.8%
90 RAM ProMaster 3500 EV 45.9%
89 RAM ProMaster 3500 45.9%
88 RAM ProMaster 2500 45.9%
87 Ford E-Transit-350 Cargo Van 45.9%
86 RAM ProMaster Cargo Van 45.9%
85 GMC Savana Passenger 45.9%
84 Chevrolet Express Passenger 45.9%
83 RAM ProMaster 1500 45.9%
82 GMC Savana Cargo 45.9%
81 Chevrolet Express Cargo 45.9%
80 Volkswagen Jetta 45.9%
79 Hyundai IONIQ 5 N 46.3%
78 Hyundai Palisade 46.3%
77 Hyundai Venue 46.3%
76 Chevrolet Silverado 1500 46.4%
75 Kia K5 46.4%
74 Kia K4 46.4%
73 Kia Forte 46.4%
72 RAM 1500 47.0%
71 Jeep Gladiator 47.0%
70 Hyundai Tucson 47.2%
69 Chevrolet Silverado 2500HD 47.3%
68 Chevrolet Colorado 47.6%
67 Kia Niro 48.0%
66 Volkswagen Golf R 48.8%
65 Honda Passport 49.0%
64 Kia Soul 49.6%
63 GMC HUMMER EV Pickup 49.9%
62 GMC Sierra EV 49.9%
61 Toyota Highlander 50.3%
60 Subaru Legacy 50.4%
59 Mazda Mazda3 Sedan 50.6%
58 Hyundai Kona 50.6%
57 Mitsubishi Mirage G4 51.4%
56 Subaru Forester 51.5%
55 MINI Hardtop 51.5%
54 Mazda CX-70 51.7%
53 Mazda CX-90 51.7%
52 Mazda CX-50 51.7%
51 Mazda CX-5 51.7%
50 Mazda CX-30 51.7%
49 Nissan GT-R 52.0%
48 Nissan Z 52.0%
47 Toyota GR Supra 52.0%
46 Subaru BRZ 52.0%
45 Toyota GR86 52.0%
44 GMC Sierra 2500HD 52.1%
43 Nissan Frontier 52.1%
42 Toyota Sequoia 52.7%
41 Hyundai Elantra 53.2%
40 Jeep Compass 53.5%
39 Volkswagen Golf GTI 53.8%
38 Hyundai Santa Cruz 54.4%
37 Mazda Mazda3 Hatchback 54.4%
36 Honda Civic Hatchback 54.4%
35 Toyota Camry 54.6%
34 Honda Ridgeline 54.8%
33 Honda Accord 55.0%
32 Toyota RAV4 55.6%
31 GMC Canyon 55.9%
30 Ford F-450 56.7%
29 RAM 3500 56.7%
28 RAM 2500 56.7%
27 Ford F-350 56.7%
26 Ford F-250 56.7%
25 Mitsubishi Mirage 56.7%
24 Subaru WRX 58.0%
23 Toyota Land Cruiser 58.3%
22 Toyota Grand Highlander 58.7%
21 Toyota Crown Signia 58.7%
20 Toyota RAV4 Prime 58.7%
19 Toyota Venza 58.7%
18 Toyota Corolla Cross 58.7%
17 Honda CR-V 58.9%
16 Honda Civic Si 59.4%
15 Toyota Prius 59.6%
14 Subaru Crosstrek 60.4%
13 Toyota GR Corolla 60.5%
12 Toyota Corolla Hatchback 60.5%
11 Toyota Tundra 60.7%
10 Toyota Prius Prime 61.4%
9 Subaru Impreza 61.9%
8 GMC Sierra 3500HD 62.2%
7 Nissan Kicks 62.7%
6 Toyota Corolla 63.3%
5 Honda Civic 63.8%
4 Honda HR-V 63.9%
3 Chevrolet Silverado 3500HD 65.1%
2 Toyota 4Runner 67.7%
1 Toyota Tacoma 67.7%