

CarEdge saved me over 4,500 dollars on a brand new Honda Pilot. I can't say thank you enough.
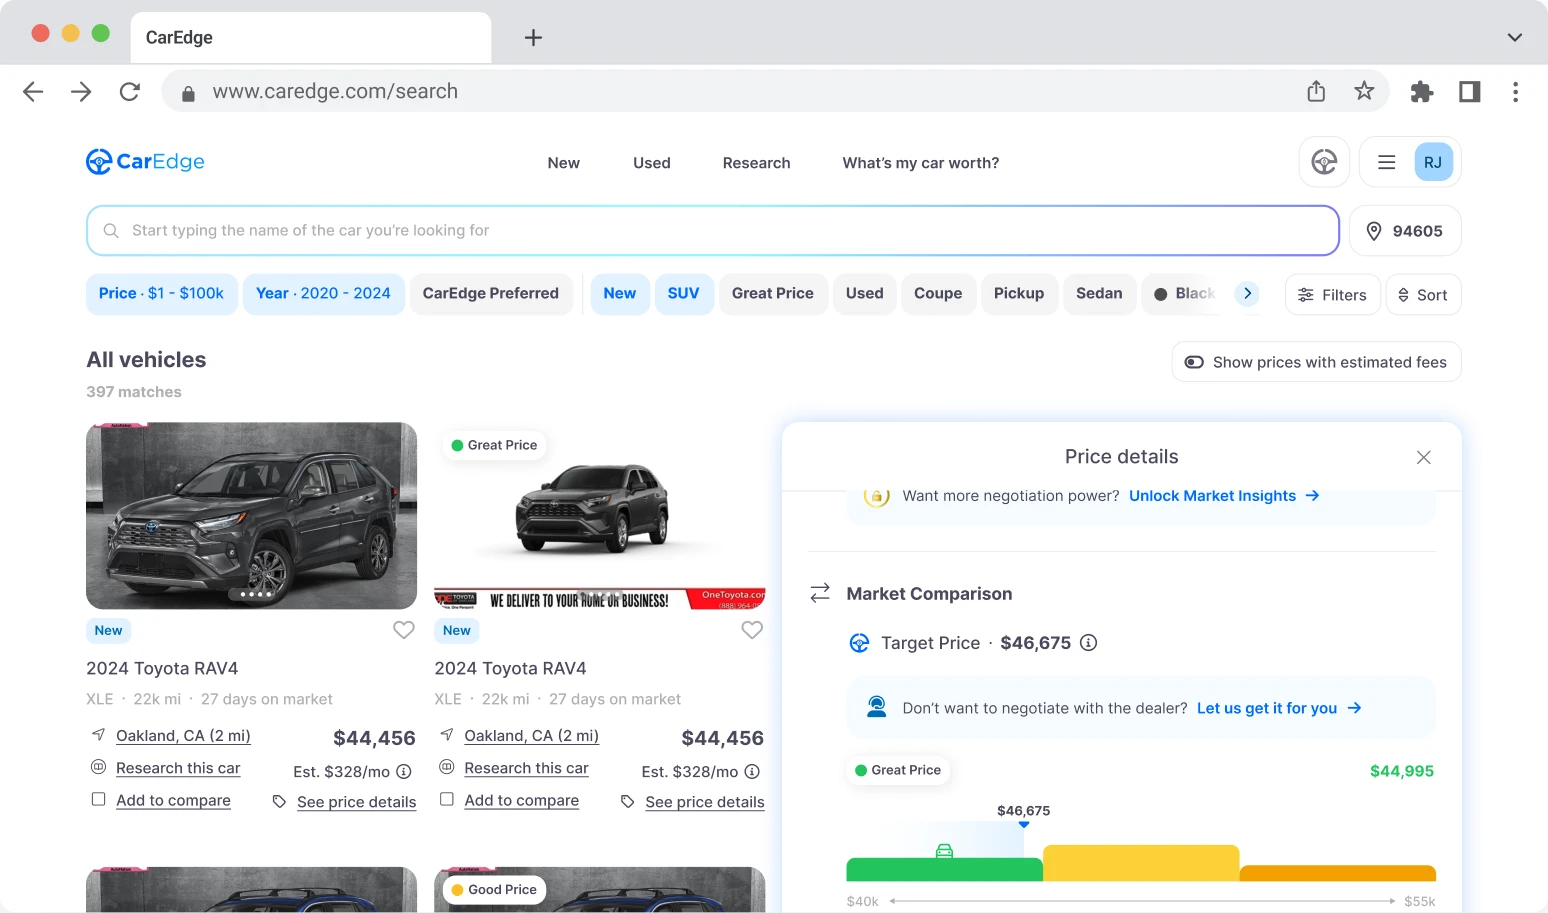
Price intelligence
Find a wide range of vehicle listings with market insights on new and used listings near you.
What can I do with CarEdge?
What can I do with CarEdge?
Get access to exclusive information so you can make an informed car buying decision — all in one place.

Find a wide range of vehicle listings with market insights on new and used listings near you.
Track your vehicle’s value and cash in when the time is right to sell.

Access to our proprietary data to help you find the right car, at the right price. Find these unlocked on every listing after subscribing.

With our expert-led, tech-enabled car buying service, we will locate, negotiate, and deliver your vehicle so you can get a new car hassle free.

Help us personalize your CarEdge experience — it only takes a second.
Your answers help us personalize your CarEdge journey — we’ll follow up with tips and next steps that match your buying timeline.
As if the auto industry needed another issue … After nearly a year of dealing with a chip shortage, automakers are on the precipice of dealing with a potentially even more crippling shortage: magnesium. The magnesium shortage has recently been reported by the Financial Times and Bloomberg. What’s going on? How will it effect car production? And most importantly, what do you need to know? We’ve got your covered.
Let’s dive in.
Magnesium is used in a variety of products. In cars, magnesium can be found in gearboxes, front end and IP beams, steering columns, driver’s air bag housings, steering wheels, seat frames and fuel tank covers. Magnesium is useful in these applications because it is lighter than alternative materials (steel and aluminum).
The International Magnesium Association (yes, that exists) has a great webpage dedicated to the history and use cases of magnesium in cars, trucks, and SUVs. The long and short of it is that magnesium has been used in automobiles since the 1920’s, and a lot of it is used in nearly every vehicle.
Automakers have been struggling to produce vehicles throughout all of 2021. An ongoing shortage of integrated circuits, also commonly referred to as “chips” has cost the auto industry more than 10 million vehicles so far in 2021 alone. More than 3,000 days of production time have been lost because of the chip shortage. Another shortage, especially a shortage of a material as important as magnesium, could be a worst case scenario for automakers that are already struggling.
Bloomberg said it best, the situation “threatens to worsen a supply squeeze that already has pushed U.S. prices close to all-time highs.”
The Financial Times reported, “The world’s largest carmakers could face a potentially crippling shortage of aluminum, as China’s power crisis threatens supplies of a key component used to make the lightweight metal.” Magnesium is used in the production of aluminum alloys.
Most of the world’s magnesium supply comes from China. For context, the association representing Germany’s metals industry warned its government in a letter Tuesday that “the current magnesium inventories in Germany and respectively in the whole of Europe will be exhausted by the end of November 2021.” This is a direct result of the fact that China accounts for 95% of Europe’s magnesium supply.
| Country | Magnesium production (thousand tonnes) |
| 800 | |
| 65 | |
| 50 (est) | |
| 25 | |
| 23 | |
| 19 | |
| 15 | |
| 10 | |
| 10 | |
| 5 |
What is the “power crisis” that The Financial Times is alluding to? It’s a perfect storm … Literally.
Flooding across key coal producing provinces in China, an increasing domestic and international demand for Chinese goods in the wake of pandemic easing, and extreme market distortions, including power rationing and price controls, have all contributed to the power crisis currently occurring in China.
Power is currently being rationed across most all Chinese provinces. It is unknown when those measures will be discontinued. There are people much smart and well-versed in this field documenting this: https://supchina.com/2021/09/28/the-three-causes-of-chinas-power-outages/
We have yet to hear from any major automaker about the magnesium shortage, however as third quarter earnings kick into high gear we would not be surprised to hear more about how the magnesium shortage is effecting production. As we get more information about the magnesium shortage we will update this page.
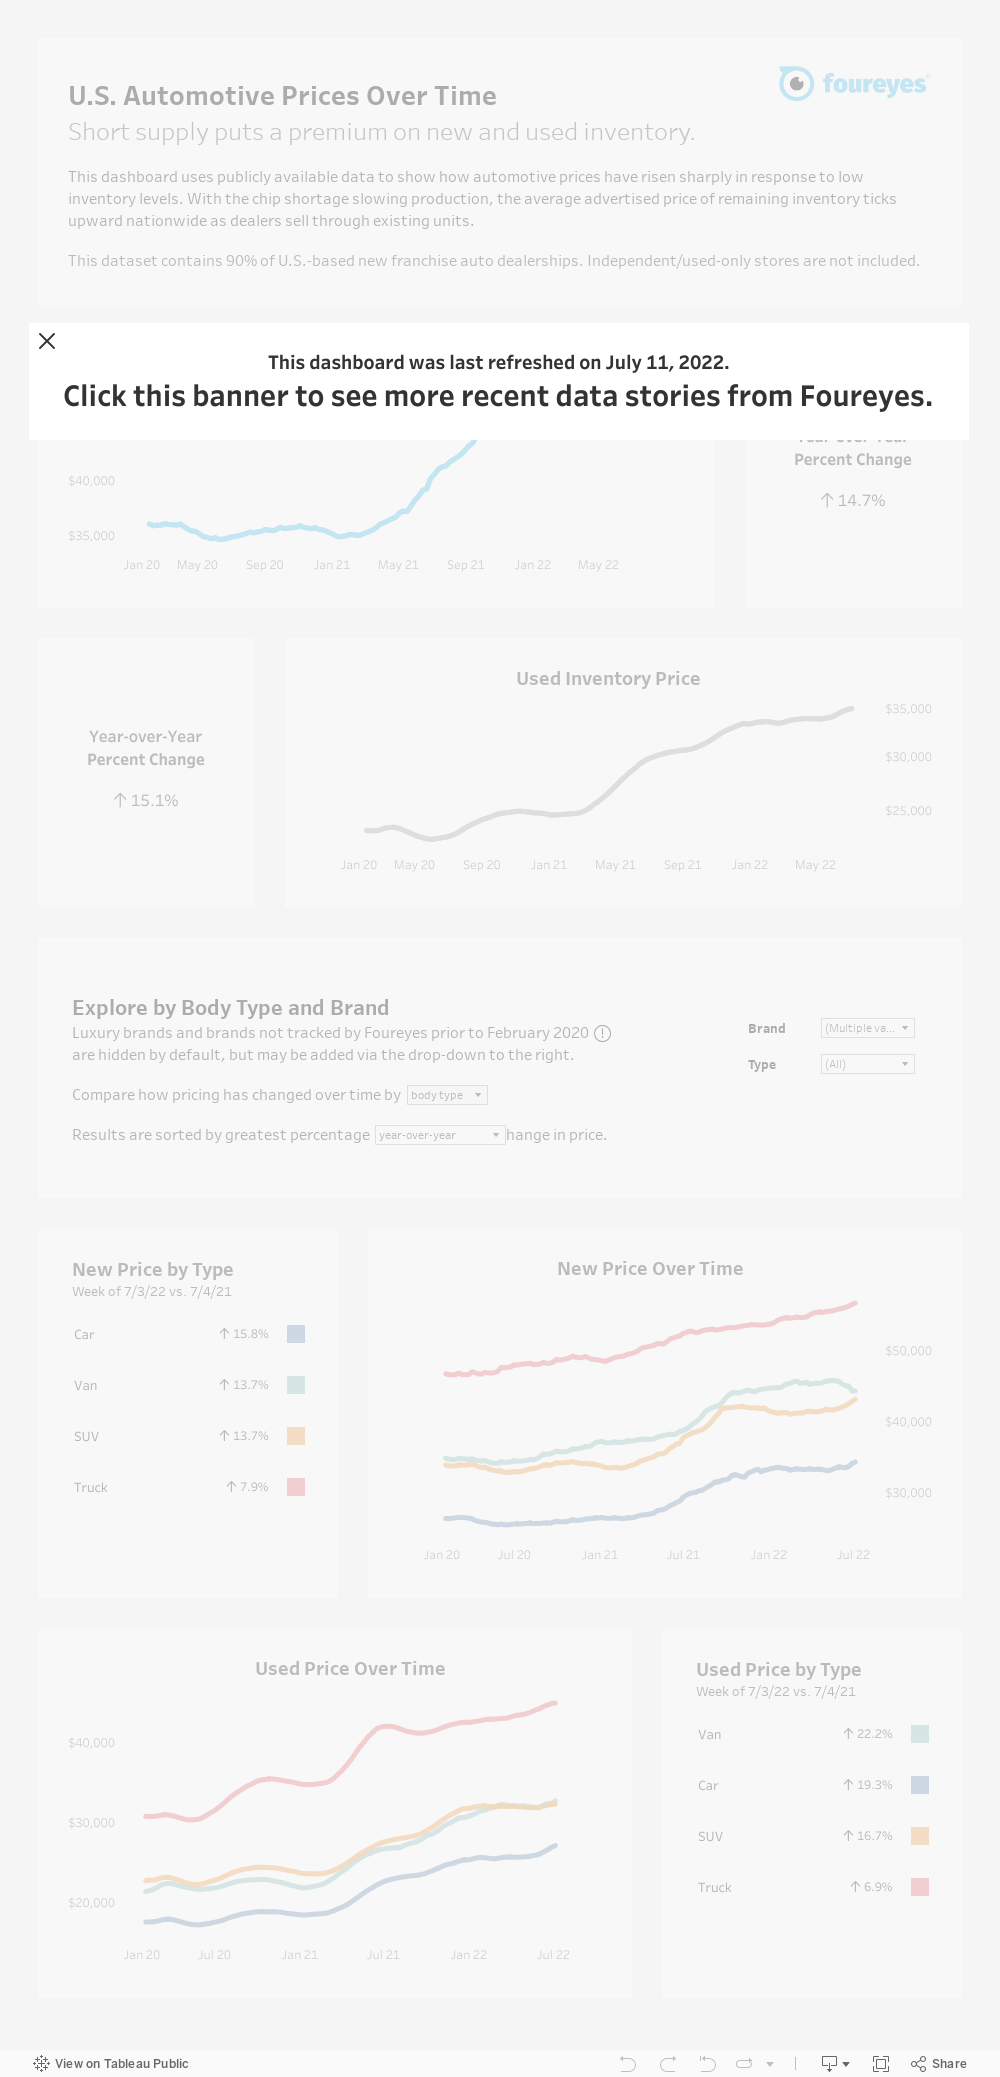
Cars, trucks, and SUVs are very expensive right now. New or used, no matter where you look, prices are high. That being said, some brands have experienced larger price increases than others. Today we’ll take a look at the automakers who have seen the largest and smallest increases in new car and used car prices. Buckle up, it’s a pretty wild ride.
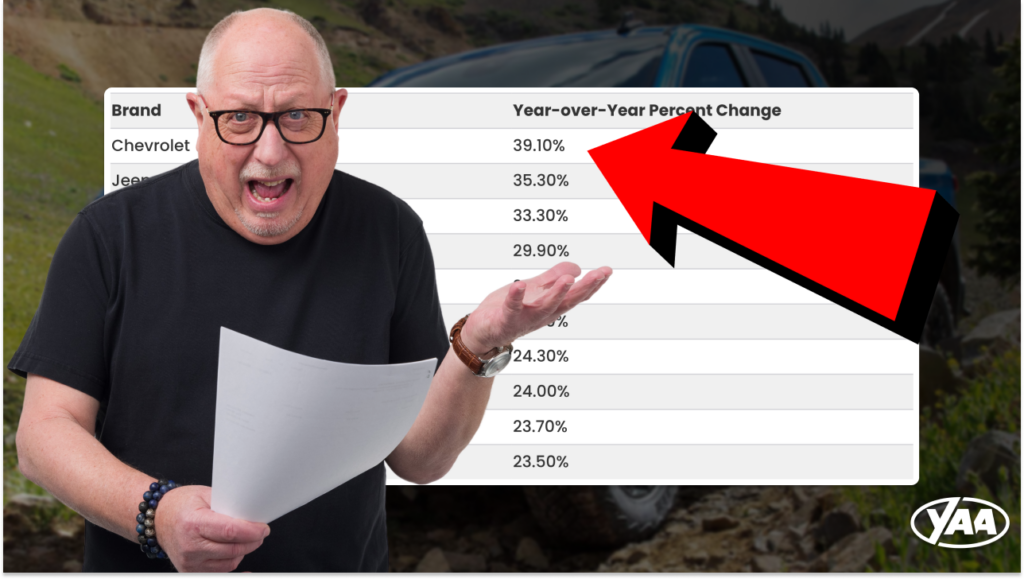
For each table we’ll be looking at the increase in price year-over-year. For example, when you see “Chevrolet” and “39.1%” that means that the average price of Chevrolet’s inventory has increased 39.1% from this time last year to today. We told you to buckle up …
Let’s dive in.
The new car market is in disarray. Every major automaker is struggling to produce enough vehicles to keep up with demand. Who is hurting the most? It appears to be Chevy.
| Brand | Year-over-Year Percent Change |
| Chevrolet | 39.10% |
| Jeep | 35.30% |
| Dodge | 33.30% |
| Nissan | 29.90% |
| Buick | 26.20% |
| Cadillac | 24.70% |
| GMC | 24.30% |
| Chrysler | 24.00% |
| Kia | 23.70% |
| Mitsubishi | 23.50% |

There’s your top ten, ladies and gentlemen. And yes, that data is accurate. The average selling price of a new Chevrolet right now is 39.1% higher than it was this time last year. Jeep comes in at number two on the list with a 35.3% gain year-over-year, and Dodge rounds out the top three with a 33.3% increase in price.
In case it wasn’t clear, GM has struggled mightily in 2021. For the first time ever, GM lost their US sales crown to Toyota. It’s no wonder the price for a new GM product has gone up so much, however these numbers are seriously incredible.

What about on the opposite end of the spectrum? Which automakers have seen their new vehicle prices increase the least?
| Brand | Year-over-Year Percent Change |
| MINI | 0.00% |
| Mercedes-Benz | 0.20% |
| Lexus | 0.50% |
| Lincoln | 2.40% |
| Audi | 3.10% |
| RAM | 4.10% |
| BMW | 4.70% |
| FIAT | 5.00% |
| Acura | 5.50% |
| Subaru | 6.00% |
Mini comes in at the number one spot, with their new car inventory prices being level with this time last year. Mercedes-Benz and Lexus round out the top three with their less than 1% increase year-over-year.
Thinking about buying an extended warranty? Get a free quote from CarEdge first!
The biggest surprise on the list may be Subaru. Subaru has some of lowest days supply of inventory in the industry right now, however their new inventory prices have only gone up 6%.

For many, the thought of buying a new car has gone out the window because new vehicle prices are simply too expensive. That leads us to wonder what is going on with used vehicles? Which automaker has seen their used inventory appreciate the most? Volkswagen.
| Brand | Year-over-Year Percent Change |
| Volkswagen | 34.40% |
| Hyundai | 31.50% |
| Toyota | 31.10% |
| Lincoln | 30.60% |
| Kia | 30.60% |
| Dodge | 29.70% |
| Chevrolet | 28.90% |
| Cadillac | 28.00% |
| Ford | 26.70% |
| Nissan | 24.70% |
The average used Volkswagen has increased in price 34.4% year-over-year. Hyundai and Toyota round out the top three, with 31%+ increases as well. One brand we were surprised not to see on this list was Mitsubishi. The Mirage is the fastest appreciating used car on the market right now.
If you’re going to buy a used car, we strongly suggest you get a pre-purchase inspection and consider a free extended warranty quote from CarEdge. These prices are insane, and the best thing you can do is get some peace of mind when spending so much money.

Which brands have seen their used car prices increase the least? Jaguar!
| Year-over-Year Percent Change | Year-over-Year Percent Change |
| Jaguar | 5.00% |
| Mazda | 11.60% |
| INFINITI | 13.00% |
| BMW | 13.50% |
| Land Rover | 14.10% |
| Audi | 15.10% |
| Alfa Romeo | 16.00% |
| Mitsubishi | 16.00% |
| Lexus | 16.30% |
| Chrysler | 17.90% |
Used Jaguar’s are only 5% more expensive today than they were this time last year. Mazda and INFINITI round out the top three. Seeing Mazda on this list (especially when Toyota and Hyundai are on the other) makes you think that buying a used Mazda right now might make more financial sense then splurging on a Toyota or a Hyundai.
This section is best viewed on a laptop or desktop!
| Brand | Year-over-Year Percent Change – New | Year-over-Year Percent Change – Used |
| Chevrolet | 39.10% | 28.90% |
| Jeep | 35.30% | 21.70% |
| Dodge | 33.30% | 29.70% |
| Nissan | 29.90% | 24.70% |
| Buick | 26.20% | 18.70% |
| Cadilac | 24.70% | 28.00% |
| GMC | 24.30% | 22.70% |
| Chrysler | 24.00% | 17.90% |
| Kia | 23.70% | 30.60% |
| Mitsubishi | 23.50% | 16.00% |
| Mazda | 22.30% | 11.60% |
| Hyundai | 20.80% | 31.50% |
| Volkswagen | 18.90% | 34.40% |
| Ford | 15.60% | 26.70% |
| Toyota | 14.50% | 31.10% |
| INFINITI | 11.40% | 13.00% |
| Honda | 8.00% | 24.40% |
| Alfa Romeo | 7.90% | 16.00% |
| Land Rover | 6.90% | 14.10% |
| Jaguar | 6.30% | 5.00% |
| Subaru | 6.00% | 18.30% |
| Acura | 5.50% | 20.10% |
| FIAT | 5.00% | 18.80% |
| BMW | 4.70% | 13.50% |
| RAM | 4.10% | 23.40% |
| Audi | 3.10% | 15.10% |
| Lincoln | 2.40% | 30.60% |
| Lexus | 0.50% | 16.30% |
| Mercedes-Benz | 0.20% | 23.20% |
| MINI | 0.00% | 20.00% |
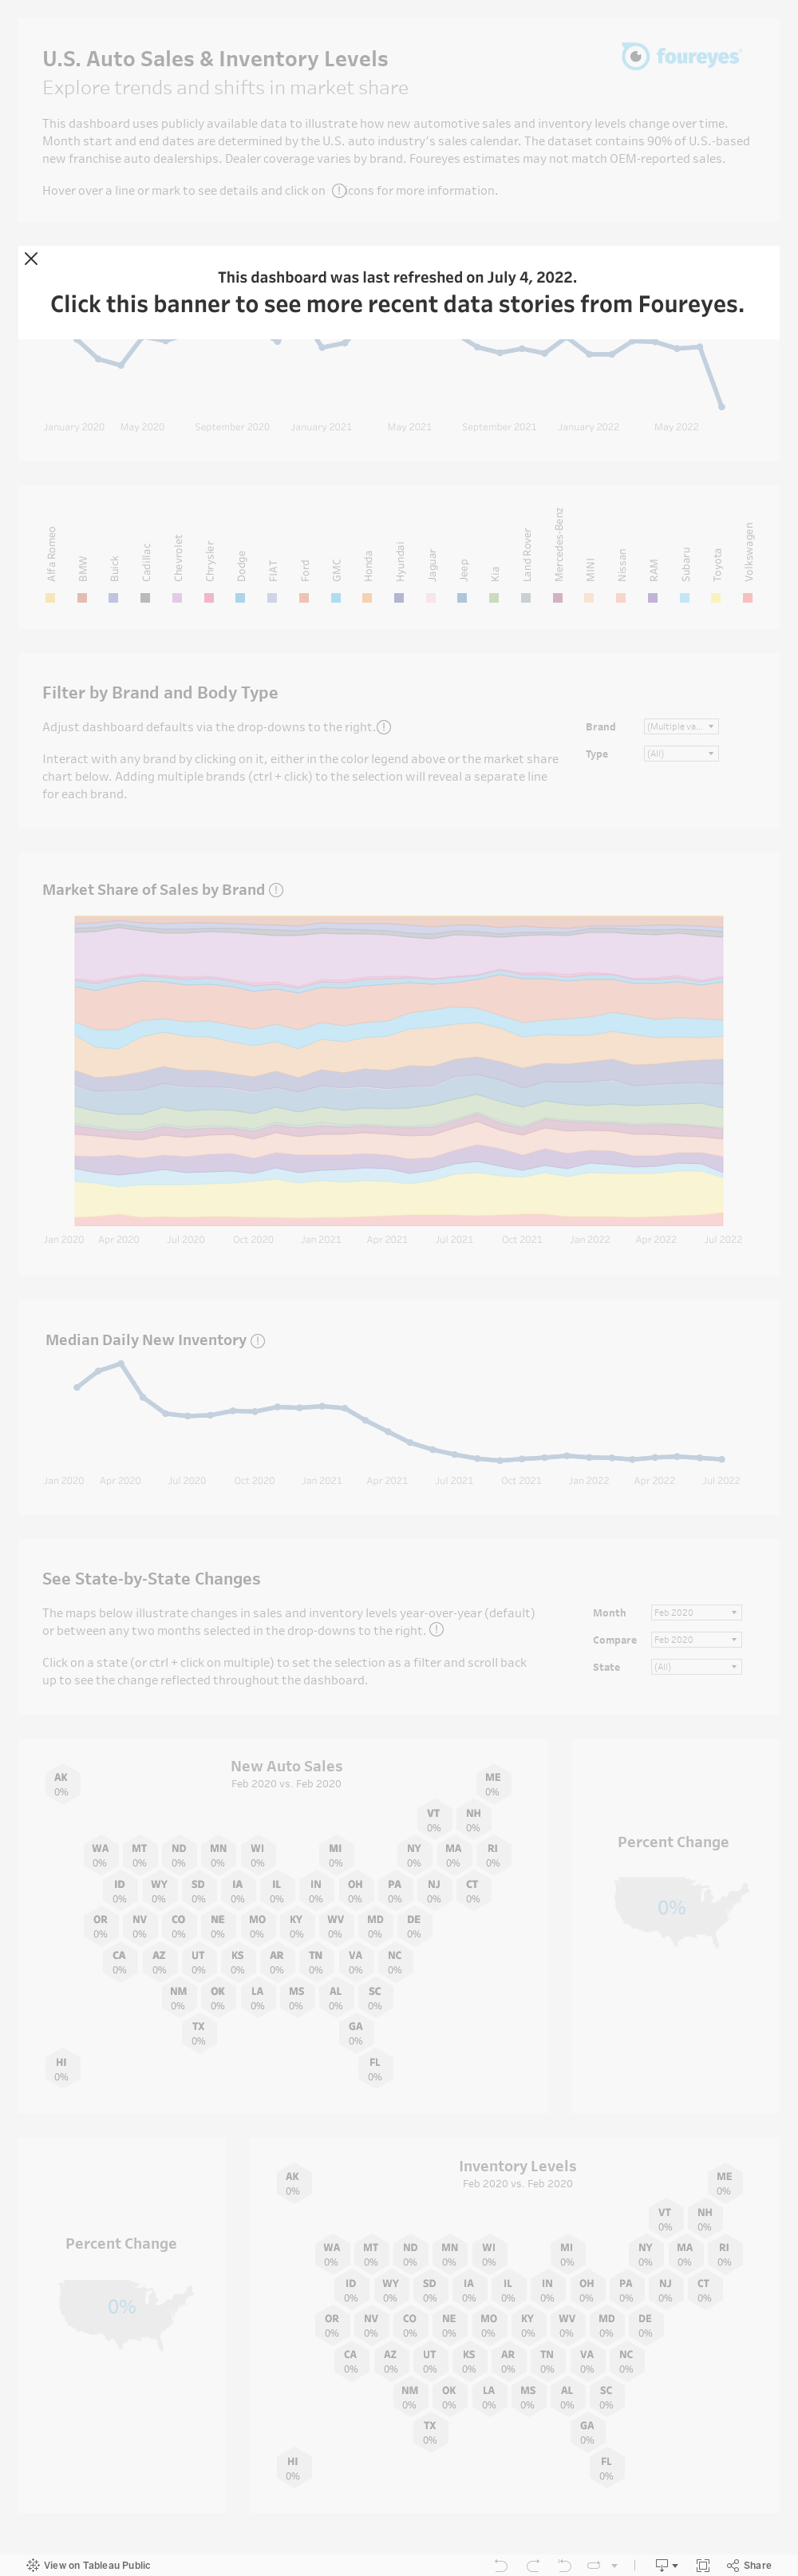
New car inventory levels have plummeted as a result of the ongoing chip shortage and supply chain issues. With car buyers looking at empty lots and more and more consumers turning to “online dealers” to find the car, truck, or SUV they’re looking for, we wondered “Do some states have more inventory than others?”
The answer is “Yes.” There are pockets of the country where inventory levels are higher than others. If you’re open to buy a car out of state, then you have options.
Let’s break down the data.
Nationally, new car inventory levels are down 67% from September of 2021 as compared to September 2020. Cox Automotive estimates that new car inventories have fallen to their lowest levels since 1985. They estimate that 915,000 new vehicles are in inventory in the United States right now. Days supply, an industry metric used to measure how many days it would take to sell the current supply of inventory based on the prior month’s sales rate is 30 days.
For perspective, dealers had 1,432,300 vehicles in inventory in the wake of the 2009 Cash for Clunkers program — about 57 percent more than they have this month.
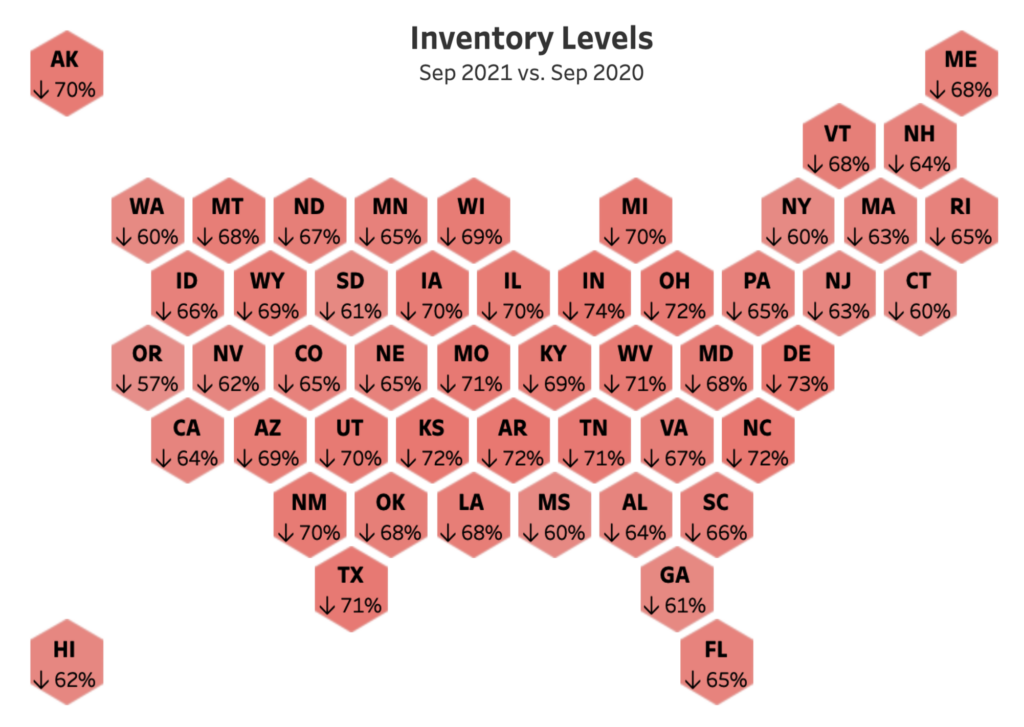
This is where things get interesting. Yes, every state is feeling the pain of “chipmageddon”, but the effects are not equal.
| State | Sep 2021 vs Sep 2020 % change |
| Oregon | ▼57% |
| Washington | ▼60% |
| Mississippi | ▼60% |
| Connecticut | ▼60% |
| New York | ▼60% |
| Georgia | ▼61% |
| South Dakota | ▼61% |
| Hawaii | ▼62% |
| Nevada | ▼62% |
| New Jersey | ▼63% |
| Massachusetts | ▼63% |
| All States | ▼67% |
Oregon is the state that has seen the least impact from the chip shortage. With that being said, the state has still experienced a 57% reduction in new car inventory. Washington state, Mississippi, Connecticut, and New York have all experienced 60% declines in new car inventory. Georgia and South Dakota are at 61%. Hawaii, Nevada are at 62%, and New Jersey and Massachusetts have seen a 63% decline in new car inventory levels.
On the other end of the spectrum, many states are feeling the pain of the chip shortage much more. Let’s look at the data.
| State | Sep 2021 vs Sep 2020 % change |
| Indiana | ▼74% |
| Delaware | ▼73% |
| North Carolina | ▼72% |
| Arkansas | ▼72% |
| Kansas | ▼72% |
| Ohio | ▼72% |
| Texas | ▼71% |
| Tennessee | ▼71% |
| Missouri | ▼71% |
| West Virginia | ▼71% |
| All States | ▼67% |
Indiana takes first place for the state with the least new car inventory. Inventory levels in Indiana are off 74% year over year. Delaware is in second place with a 73% decline in new car inventory. North Carolina, Arkansas, Kansas, and Ohio have seen 72% decreases in inventory levels, while Texas, Tennessee, Missouri, and West Virginia have each experienced a 71% decline in new vehicles for sale.
Thinking about buying an extended warranty? Get a free quote from CarEdge first!
If you need to buy a car right now you may want to look at states that have more inventory than others. For example, if you live in Indiana and you can find a Subaru you want in Oregon, it may be worth the hassle to buy it out of state and bring it back home.
For more on how to do that we encourage you to read this complete guide: https://caredge.com/guides/buying-a-vehicle-in-another-state/
This section is best viewed on a laptop or desktop!
We’ve got you covered! The team at foureyes put together this incredible data visualization. Scroll to the bottom and hover over a state to see the breakdown of inventory levels for a particular automaker.
New car inventory levels are currently at all-time lows. Take a drive down your local “automobile row” and you’ll see there aren’t many cars for sale on dealership lots. The ongoing chip shortage has dramatically impacted major automakers — GM recently had their worst quarter since 2009, Stellantis reported a near 20% decline in sales year over year for the third quarter, and Ford didn’t fare much better.

We have compiled the most up-to-date information on manufacturer’s inventory levels. Click below to jump to a particular manufacturer. Please note that we are not able to get vehicle specific inventory data for many of the manufacturers. This is something we hope to be able to provide in the near future.
You can access all of the data here: https://docs.google.com/spreadsheets/d/1sDB4ybm8F6VQotMS-HyjWv9n5IdQjTF6mbw8RwbbYXo/edit?usp=sharing
Days supply: Number of days needed to sell all vehicles in inventory, based on the previous month’s daily selling rate
Inventory: Unit count of vehicles on hand at dealerships, factory lots, ports of entry and in transit on a specific date
| Inventory Units | Days Supply on Oct. 1 | Days Supply on Sept. 1 | Change | |
| Maverick | 3,900 | 193 | – | 193 |
| Continental | 100 | 179 | 104 | 75 |
| Transit Connect | 1,500 | 98 | 68 | 30 |
| EcoSport | 6,500 | 90 | 44 | 46 |
| Mustang Mach-E | 5,000 | 79 | 45 | 34 |
| Genesis car | 4,100 | 68 | 58 | 10 |
| RLX | – | 67 | 275 | -208 |
| Fusion | 100 | 60 | 42 | 18 |
| E-series van | 7,400 | 57 | 50 | 7 |
| Mustang | 6,000 | 55 | 56 | -1 |
| Ranger | 10,100 | 49 | 44 | 5 |
| Clarity | 200 | 49 | 43 | 6 |
| Edge | 12,800 | 47 | 38 | 9 |
These are the vehicles with the highest current days supply of inventory. You can check the current inventory levels of a particular vehicle in your market by running a free market price report in your CarEdge account.
See your local inventory levels| Inventory Units | Days Supply on Oct. 1 | Days Supply on Sept. 1 | Change | |
| ILX | 100 | 5 | 12 | -7 |
| Subaru trk. | 6,400 | 5 | 7 | -2 |
| Subaru car | 1,700 | 6 | 13 | -7 |
| Civic | 2,200 | 9 | 17 | -8 |
| NSX | – | 10 | 15 | -5 |
| Odyssey | 2,400 | 11 | 20 | -9 |
| Toyota car | 16,600 | 11 | 15 | -4 |
| Total Hyundai | 26,700 | 12 | 18 | -6 |
| MDX | 1,100 | 13 | 9 | 4 |
| Kia car | 13,000 | 13 | 10 | 3 |
| Mazda car | 2,300 | 13 | 15 | -2 |
| Mazda trk. | 10,100 | 13 | 13 | – |
| Accord | 6,900 | 14 | 21 | -7 |
| Insight | 1,100 | 14 | 22 | -8 |
| Hyundai car | 11,700 | 15 | 21 | -6 |
These are the vehicles with the lowest days supply of inventory right now. Don’t expect to get a “deal” on any of these vehicles, because the dealership knows they have very little inventory.
Learn more about the chip shortage. Read: The How We Ran out of Cars in the US
| Inventory Units | Days Supply on Oct. 1 | Days Supply on Sept. 1 | Change | |
| Fusion | 100 | 60 | 42 | 18 |
| Mustang | 6,000 | 55 | 56 | -1 |
| Bronco | 5,000 | 37 | 17 | 20 |
| Bronco Sport | 12,600 | 27 | 56 | -29 |
| E-series van | 7,400 | 57 | 50 | 7 |
| EcoSport | 6,500 | 90 | 44 | 46 |
| Edge | 12,800 | 47 | 38 | 9 |
| Escape | 14,500 | 32 | 31 | 1 |
| Expedition | 7,900 | 34 | 38 | -4 |
| Explorer | 23,400 | 29 | 64 | -35 |
| F series | 94,200 | 37 | 41 | -4 |
| Maverick | 3,900 | 193 | – | 193 |
| Mustang Mach-E | 5,000 | 79 | 45 | 34 |
| Ranger | 10,100 | 49 | 44 | 5 |
| Transit | 11,900 | 30 | 39 | -9 |
| Transit Connect | 1,500 | 98 | 68 | 30 |
| Total Ford | 222,800 | 38 | 43 | -5 |
Ford invoice pricing can be found here: https://caredge.com/guides/ford-invoice-price/
| Inventory Units | Days Supply on Oct. 1 | Days Supply on Sept. 1 | Change | |
| Continental | 100 | 179 | 104 | 75 |
| Aviator | 1,800 | 26 | 55 | -29 |
| Corsair/MKC | 2,500 | 31 | 55 | -24 |
| Nautilus/MKX | 3,500 | 33 | 35 | -2 |
| Navigator | 1,400 | 29 | 39 | -10 |
| Total Lincoln | 9,300 | 30 | 42 | -12 |
| Inventory Units | Days Supply on Oct. 1 | Days Supply on Sept. 1 | Change | |
| ILX | 100 | 5 | 12 | -7 |
| NSX | – | 10 | 15 | -5 |
| RLX | – | 67 | 275 | -208 |
| TLX | 2,000 | 26 | 33 | -7 |
| MDX | 1,100 | 13 | 9 | 4 |
| RDX | 4,000 | 21 | 23 | -2 |
| Total Acura | 7,200 | 19 | 20 | -1 |
| Inventory Units | Days Supply on Oct. 1 | Days Supply on Sept. 1 | Change | |
| Accord | 6,900 | 14 | 21 | -7 |
| Civic | 6,000 | 16 | 13 | 3 |
| Civic | 2,200 | 9 | 17 | -8 |
| Total Civic | 8,200 | 13 | 14 | -1 |
| Clarity | 200 | 49 | 43 | 6 |
| Fit | – | – | 10 | -10 |
| Insight | 1,100 | 14 | 22 | -8 |
| CR-V | 14,800 | 21 | 13 | 8 |
| HR-V | 13,900 | 28 | 32 | -4 |
| Odyssey | 2,400 | 11 | 20 | -9 |
| Passport | 4,500 | 19 | 39 | -20 |
| Pilot | 11,100 | 23 | 35 | -12 |
| Ridgeline | 2,700 | 25 | 28 | -3 |
| Total Honda | 65,800 | 19 | 21 | -2 |
| Inventory Units | Days Supply on Oct. 1 | Days Supply on Sept. 1 | Change | |
| Genesis car | 4,100 | 68 | 58 | 10 |
| Genesis trk. | 3,700 | 28 | 31 | -3 |
| Total Genesis | 7,800 | 40 | 40 | – |
| Inventory Units | Days Supply on Oct. 1 | Days Supply on Sept. 1 | Change | |
| Hyundai car | 11,700 | 15 | 21 | -6 |
| Hyundai trk. | 15,000 | 11 | 15 | -4 |
| Total Hyundai | 26,700 | 12 | 18 | -6 |
| Inventory Units | Days Supply on Oct. 1 | Days Supply on Sept. 1 | Change | |
| Kia car | 13,000 | 13 | 10 | 3 |
| Kia trk. | 19,000 | 17 | 19 | -2 |
| Total Kia Motors | 32,000 | 15 | 15 | – |
| Inventory Units | Days Supply on Oct. 1 | Days Supply on Sept. 1 | Change | |
| Mazda car | 2,300 | 13 | 15 | -2 |
| Mazda trk. | 10,100 | 13 | 13 | – |
| MAZDA N.A. | 12,400 | 13 | 13 | – |
| Inventory Units | Days Supply on Oct. 1 | Days Supply on Sept. 1 | Change | |
| Subaru car | 1,700 | 6 | 13 | -7 |
| Subaru trk. | 6,400 | 5 | 7 | -2 |
| SUBARU OF AMERICA | 8,100 | 5 | 7 | -2 |
| Inventory Units | Days Supply on Oct. 1 | Days Supply on Sept. 1 | Change | |
| Lexus car | 5,900 | 29 | 24 | 5 |
| Lexus trk. | 19,000 | 27 | 24 | 3 |
| Total Lexus | 24,900 | 27 | 24 | 3 |
| Inventory Units | Days Supply on Oct. 1 | Days Supply on Sept. 1 | Change | |
| Toyota car | 16,600 | 11 | 15 | -4 |
| Toyota trk. | 66,600 | 18 | 18 | – |
| Total Toyota | 83,200 | 16 | 17 | -1 |
| Inventory Units | Days Supply on Oct. 1 | Days Supply on Sept. 1 | Change | |
| 60 series | 1,600 | 37 | 46 | -9 |
| 90 series | 100 | 34 | 31 | 3 |
| XC40 | 1,500 | 18 | 22 | -4 |
| XC60 | 4,200 | 33 | 37 | -4 |
| XC90 | 2,700 | 23 | 26 | -3 |
| VOLVO CAR USA | 10,100 | 27 | 30 | -3 |
The latest on used car prices:
Updated 10/27/21
Wholesale used car prices are increasing in value more rapidly than before. Car prices appreciated .83% this past week.
Conventional wisdom no longer holds true; used cars are appreciating assets. For the past 18 months, used cars have increased in value rather than decrease. The old adage “you lease things that depreciate, and buy things that appreciate” (thank you for that Paul Getty) used to apply to cars quite easily, however nowadays it does not.
In this post we’ll run through the latest data on used vehicle appreciation. Which types of vehicles are increasing in value the most, what specific cars have seen the biggest increase in value as a result of the ongoing chip crisis, and when do we expect used car prices to reach their peak. We’ll touch on that, and more. Let’s dive in.
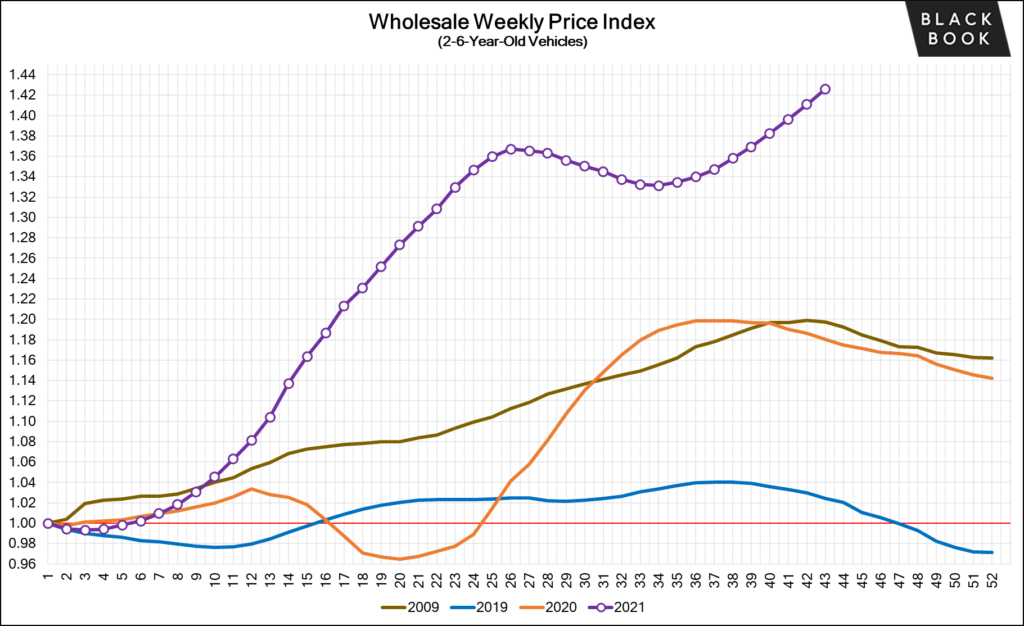
Let’s start with the big picture. Data form Black Book shows that wholesale used car prices are up more than 40% from the beginning of 2021. In the graph below 2021 is the purple line. You can see the insane increase in price as compared to last year, 2019, and 2009. The weekly changes in wholesale price appear to be getting larger.
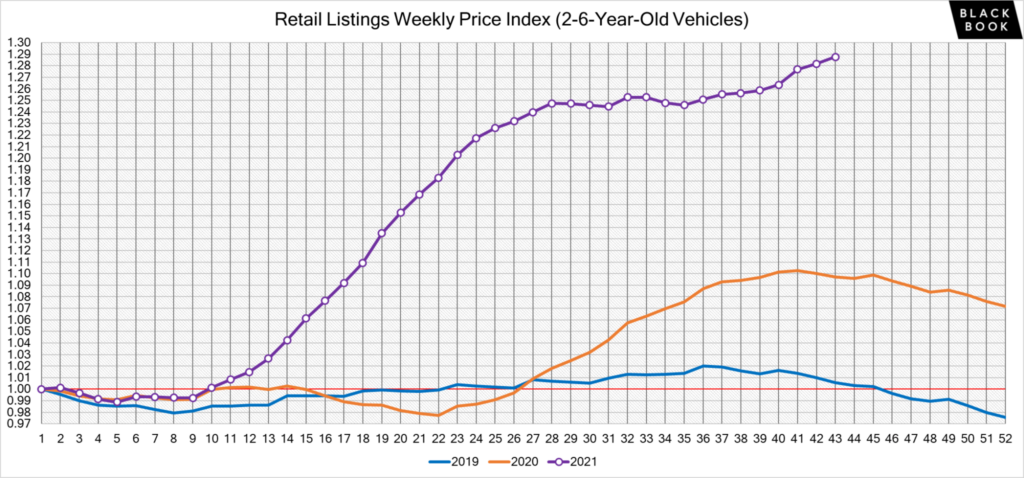
Retail prices are increasing as well, but not as rapidly as wholesale prices. Retail prices are now up 29% from the beginning of 2021. Again, you can compare this year to those in the recent past. The price increase is truly remarkable. Our expectation is that retail used car prices will continue to increase so long as the chip shortage is effecting new car supply.
A major issue facing car dealers is the fact that used car inventory levels are much lower than they should be. Again, the purple line shows 2021, and you can see that dealers have 17% fewer used vehicles listed for sale right now as compared to the beginning of this year.
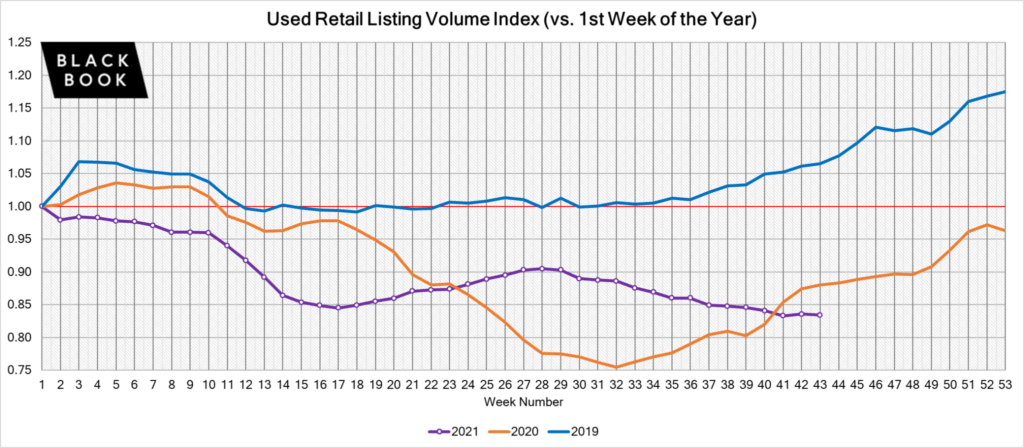
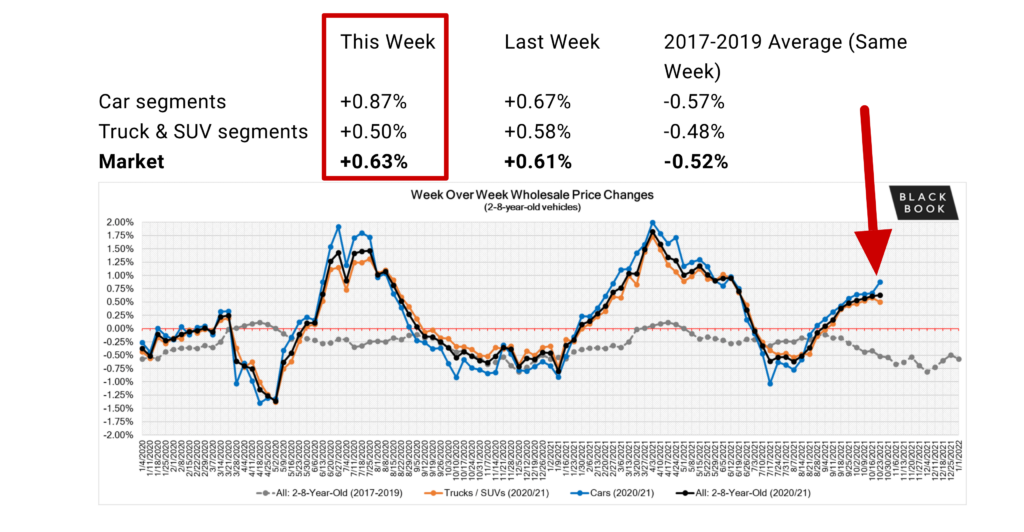
Black Book, which produces a weekly report, has tracked eight straight weeks of wholesale used vehicle price gains. Weekly price increases have become larger in recent weeks, indicating that the supply and demand of used vehicles is again going “out of whack.”
Last week

This week
Recent Q3 earnings reports from the major automakers make it clear why used car prices are ticking back up. GM reported a 33% decrease in sales year over year for the third quarter. This is a direct result of chip shortage, and GM’s inability to produce more new vehicles. Other American manufacturers saw their Q3 numbers take a dive. Ford‘s sales were down 27% for example.
So long as new car manufacturers cannot produce vehicles, used car prices will continue to climb.
Used car appreciation has been uniform across all makes, models, and trims, however some body styles and classes of vehicles have seen the most aggressive price increases.
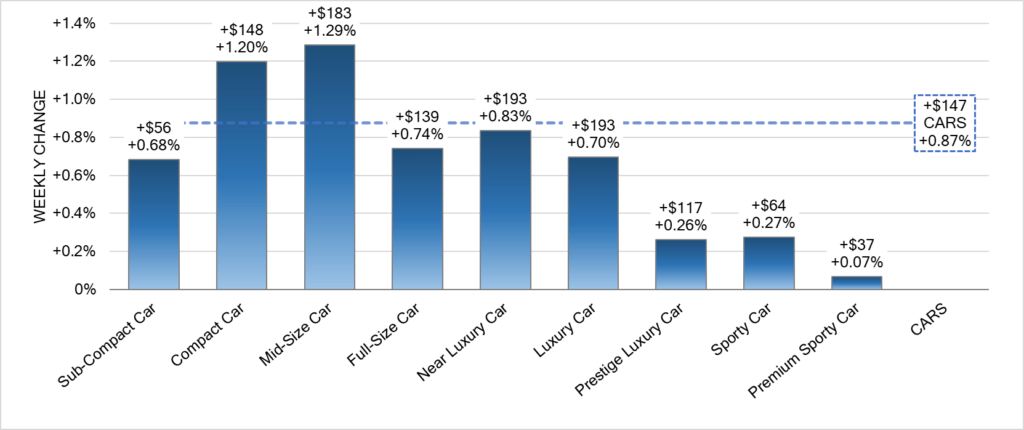
Mid-size and compact cars have seen incredible price appreciation over the past few weeks. This is because their price point is more “affordable” compared to everything else. We use the term “affordable” loosely here, because in the past you could find a decent used car for less than $15,000, however nowadays they are few and far between.
@zachshefska ##usedcar prices are through the roof … the ##mitsubishi ##mirage is up 50% year over year 🥵🤔🧐
♬ The Home Depot Beat – The Home Depot
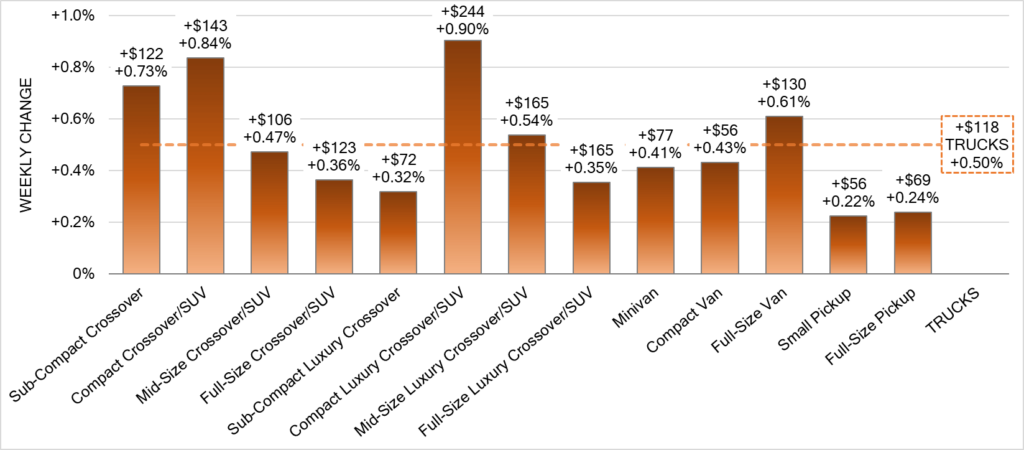
Similarly to cars, we’ve seen rapid appreciation of compact crossovers and SUVs. The most aggressive appreciation has been seen amongst sub-compact luxury crossovers. Week over week Black Book shows a .9% increase in wholesale prices for sub-compact luxury crossovers. That’s insane! Vans also continue their rapid appreciation as well.

Thanks to research from iseecars, we know that the Mitsubishi Mirage is the car that has appreciated the most over the past year. Up nearly 50% year over year, the Mirage has increased in value rapidly due to the fact that it is one of the remaining few “affordable” (again we use that word loosely) cars in the market.
We recently published data on which brands have seen their new and used prices increase the most (and least) year-over-year: https://caredge.com/guides/which-brands-prices-have-increased-the-most-least-in-2021/
No. From all of the data we’ve been able to get our hands on, it looks like there isn’t a single style of vehicle or particular nameplate that is not increasing in value right now. We know that certain vehicles are appreciating less than others, however all vehicles are increasing in value right now.
Luxury vehicles, and in particular luxury SUVs are appreciating much less rapidly than other vehicles. Take for example the Mercedes-Benz GLC, it has only appreciated 8% year over year. This further reinforces the theory for why the Mirage has increased in value nearly 50%; consumers need affordable and attainable used cars, not expensive and luxurious ones.
Although our crystal ball has been notoriously cloudy here at CarEdge, we feel confident in saying that used car prices will continue to increase well into 2022. Even when automakers get production back up to speed for new vehicles, there will be lingering effects from this period of time where they have not been able to produce at expected capacity.
Also, the price to produce new vehicles has gone up. As a result of the chip shortage (and other supply chain issues), we expect MSRP on new vehicles to be considerably higher than before. Why? Because the manufacturers costs are increasing, and they will likely pass that along to the consumer. As a result, the demand for used cars will continue to be high because used cars (especially vehicles like the Mitsubishi Mirage) will be the only “attainable” price point vehicles for many people.
For these reasons, we think week over week, and month over month used car price increases will continue for at least another 12 months.
If used car prices are likely going to continue to appreciate, it would make sense to hold onto your used vehicle and wait to sell it. That being said, our best recommendation is to track the value of your used vehicle weekly. To do this we encourage you to use the “value my vehicle” section of your CarEdge account. You should also get quotes from Carvana, Vroom, CarMax, etc.
There may be small fluctuations in price from week to week, but we expect the price of your vehicle to gradually increase overtime. The indicator for when to sell will be when you see week over week declines in the value of your vehicle.
Our recommendation has been, and will continue to be to stop buying cars! We’re so passionate about this that we even made a website: http://stopbuyingcars.com/
However, if you need to buy a used car right now, here’s what you need to remember.
The only way to know if you’re getting a fair deal is to get the out-the-door price from the seller and then compare that to the vehicle’s value. To get the out-the-door price follow this guide:
To know if the vehicle’s price is fair, we encourage you to run the VIN through the CarEdge vehicle valuation page and to also get a quote from Carvana to see what they would pay to buy the car right now. If the Carvana quote is close to what you are paying for the vehicle, then it’s likely a pretty fair deal.
In today’s market, with “rougher” used cars for sale it is critically important that you get a pre-purchase inspection done on the vehicle you are thinking of purchasing. We have heard too many horror stories of people buying used cars “as-is” and then getting stuck with a piece of junk. Avoid that, and get a PPI!
Last but not least, consider getting an extended warranty on your used vehicle. CarEdge partnered with AUL Corporation to sell vehicle service contracts with a flat markup, transparent pricing, and free consultations with an Auto Advocate. If we can help you protect your use car, we want to. More on that here: https://caredge.com/extended-warranty/


